Research Questions
- What would be the impact on the adequacy of the patterns if (1) no Dairy foods were consumed, (2) if calcium was obtained from nondairy sources (including fortified foods), and (3) if the proportions of milk and yogurt to cheese were modified?
- What is the relationship between changes in types of beverages consumed (milk compared with sugar-sweetened beverages) and diet quality?
Background
Note: Please see DGAC Report Appendix E3.1, Modeling Analysis: Adequacy of USDA Food Patterns for more background information about development of the USDA food patterns.
The USDA Food Patterns are designed to meet the known nutrient needs of the age/gender groups for which they are targeted within calorie constraints. The patterns include recommended amounts to eat from five major food groups, one of which is the Dairy Group. The Dairy Group includes fluid milks, soymilk, cheeses, yogurt, and other foods that contain these dairy products, such as milk-based meal replacements, ice cream, and other frozen desserts. Other plant-based “milks” such as almond milk and rice drinks are currently not included in the Dairy group. Traditionally, the Dairy Group has been identified as a separate food group because it is the primary source of calcium, a nutrient of public health concern in American diets. In addition, dairy products are a major source of other nutrients of concern—potassium and vitamin D, and shortfall nutrients, including magnesium, and vitamin A. In the U.S., 42% of individuals 1 year and over have calcium intakes below the EAR, and 94% have intakes of vitamin D below the EAR (1). According to 2010 food supply data, 71.8 percent of the calcium consumed by Americans is from milk and milk products (2).
Over time, the mix of products consumed within the Dairy Group has shifted, with less fluid milk and more cheese being consumed. Much of the increase in cheese consumption has come from mixed dishes including cheese, such as pizza, burgers, pasta dishes, and other grain-based dishes. The nutrient content of cheese differs somewhat from that of milk. Therefore, the USDA Food Patterns have created a nutrient profile for the Dairy Group that contains cheese, yogurt, and soymilk in addition to milk, to reflect the nutrients that would be obtained from consuming a typical mix of foods from this group, in nutrient-dense forms.
The USDA Food Patterns include 3 cup equivalents of dairy products per day in patterns that are targeted to preteens, teens, and adults. The amounts included for younger children are 2 cups for 2 and 3 year olds, and 2 ½ cups for 4 to 8 years olds. For various reasons, some individuals do not consume dairy products. Therefore, the 2010 Dietary Guidelines for Americans (p. 38) noted:
“Milk and milk products contribute many nutrients, such as calcium, vitamin D (for products fortified with vitamin D), and potassium, to the diet. Moderate evidence shows that intake of milk and milk products is linked to improved bone health, especially in children and adolescents. Moderate evidence also indicates that intake of milk and milk products is associated with a reduced risk of cardiovascular disease and type 2 diabetes and with lower blood pressure in adults.”
“It is especially important to establish the habit of drinking milk in young children, as those who consume milk at an early age are more likely to do so as adults. For individuals who are lactose-intolerant, low-lactose and lactose-free milk products are available.”
This analysis was conducted to examine the nutritional consequences of not consuming milk and milk products, to explore possible food alternatives to fill the nutrient gaps left in the diet if milk and milk products are not consumed, to examine any potential benefits of shifting amounts consumed within the Dairy Group from cheese to more fluid milk, and to examine the differences in diet quality when substituting sugar-sweetened beverages (soft drinks, fruit drinks, sports beverages, etc.) for milk.
Methods
- For each nutrient assessed in the food intake patterns, identified the amounts and proportions of the nutrient contributed by the Dairy Group in the current patterns.
- Removed Dairy Group recommended intakes from the patterns and identified the nutrients that were less than goal amounts at each calorie level.
- Identified the amount of non-dairy sources of calcium that would be needed to bring calcium to adequate amounts, and identified their other nutrient contributions if used as alternatives to dairy products.
- Calculated changes in nutrient levels in each pattern, and the most feasible ways to compensate through alternative food selections, without exceeding the caloric level of the pattern, if no dairy products were consumed.
- Identified changes in the nutrients provided by the Dairy Group with varying proportions of low fat or fat-free fluid milk and cheese:
- Current intake proportions (roughly 52% fluid milk, 45% cheese)
- All fluid fat-free milk
- 2 cup equivalents fluid fat-free milk and 1 cup equivalent lowfat cheese (67%, 33%)
- Identified changes in the nutrients provided in each pattern if fluid milk was replaced in the pattern with sugar sweetened beverages.
Results
Nutrient Contribution of Dairy Group in USDA Food Patterns
The USDA Food Patterns at 1600 – 3200 calories include 3 cup equivalents from the Dairy Group, which contributes 7 to 14 percent of the calories in the patterns. As shown in Table 1, the Dairy Group is a proportionately greater contributor to levels of protein, calcium, magnesium, phosphorus, potassium, zinc, selenium, vitamin A, vitamin D, riboflavin, vitamin B-12, and choline than to calories in the patterns. In the 2000 calorie pattern, the Dairy Group contributes only 12 percent of the calories, but almost 70 percent of the calcium and 65 percent of the vitamin D; 33-42 percent of the phosphorus, vitamin A, riboflavin, and vitamin B-12; and 21-29 percent of the protein, potassium, zinc, and choline. The Dairy group also contributes considerable amounts of sodium to the patterns, with the majority of this being from cheese. Of the 35% of sodium from the Dairy group (Table 1), almost 25% comes from cheese and just over 10% from milk, yogurt, and soymilk.
Table 1. Amount and Proportion of Selected Nutrients in USDA Food Patterns Contributed by the Dairy Group.
| Nutrient Amount in 2000 calorie Pattern* | Proportion from Dairy Group in the 2000 calorie Pattern | Proportion from Dairy Group—Range in Patterns from 1600 to 3200 calories* | |
|---|---|---|---|
| Macronutrients | |||
| Minerals | |||
| Vitamins | |||
| Fats and Fatty Acids | |||
| Energy (kcal) | 231 kcal | 12% | 7-14% |
| Protein | 26 g | 29% | 22-31% |
| Total Lipid (Fat) | 2.8 g | 4% | 2-5% |
| Carbohydrate | 25.3 g | 10% | 6-13% |
| Calcium | 884 mg | 69% | 59-73% |
| Iron | 0.3 mg | 2% | 1-2% |
| Magnesium | 60 mg | 17% | 12-19% |
| Phosphorus | 696 mg | 41% | 31-44% |
| Potassium | 706 mg | 21% | 15-25% |
| Sodium | 605 mg | 35% | 26-39% |
| Zinc | 3.4 mg | 24% | 17-26% |
| Vitamin A (in μg RAE) | 295 μg | 33% | 24-37% |
| Vitamin E (in mg AT) | 0.1 mg | 1% | 1-2% |
| Vitamin D | 178 IU | 65% | 57-67% |
| Riboflavin | 0.9 mg | 42% | 32-46% |
| Vitamin B-12 | 2.5 μg | 36% | 29-38% |
| Choline | 73 mg | 21% | 16-24% |
| Cholesterol | 20 mg | 10% | 7-11% |
| Saturated Fatty Acids | 1.6 g | 9% | 5-13% |
| Monounsaturated Fatty Acids | 0.8 g | 3% | 2-4% |
| Polyunsaturated Fatty Acids | 0.2 g | 1% | 1% |
* Patterns include 3 cup equivalents from the Dairy Group.
Data sources: NHANES 2009-2010 and NDB-SR26
Since some nutrients are provided in ample amounts in the USDA Food Patterns, an additional analysis was conducted to determine which nutrient levels would fall below goal amounts if the Dairy Group was eliminated from the patterns. Table 2 shows summarized results of nutrient levels as actual amounts and percent of nutrient goals in the base USDA Food Patterns and patterns from which the Dairy Group has been removed. When the Dairy Group is removed, levels of calcium, magnesium, iron, vitamin A, and riboflavin drop below 100 percent of goals in some or all patterns. In addition, levels of potassium, Vitamin D, and choline, which are below goals in the base patterns, drop substantially lower in patterns with no Dairy Group. Shortfalls relative to goals when the Dairy Group is removed are largest for calcium, vitamin D, potassium, and choline. Removing the Dairy Group lower calcium levels by 68-88%, placing all age/gender groups well below recommended levels, bring vitamin A levels to 67% and 71% of recommended levels for older males and females respectively, lower vitamin D levels on all age/gender groups by 20-30%, lower potassium levels 15% across all age/gender groups, and lower magnesium to 69% of recommended levels for older men. (See all data in Table A1 and end of document).
Table 2. Comparison of Selected Nutrient Levels (Amounts and % of Goal) in Food Patterns at Selected Calorie Levels with Dairy Group Included (3 Milk) and Excluded (0 Milk).
| Calorie Level | 1600 | 1600 | 2000 | 2000 | 2400 | 2400 |
|---|---|---|---|---|---|---|
| Target age/sex group | F 51-70 | F 51-70 | F 19-30 | F 19-30 | M 19-30 | M 19-30 |
| Macronutrients | ||||||
| Minerals | ||||||
| Vitamins | ||||||
| Fats and Fatty Acids | ||||||
| Dairy Group Cup eqs | 3 Milk | 0 Milk | 3 Milk | 0 Milk | 3 Milk | 0 Milk |
| Energy (kcal) | 1595 | 1364 | 2003 | 1773 | 2401 | 2171 |
| Protein | 83 g | 57 g | 91 g | 65 g | 106 g | 80 g |
| % of RDA | 180% | 123% | 198% | 142% | 189% | 143% |
| % of calories | 21% | 17% | 18% | 15% | 18% | 15% |
| Total Lipid (Fat) | 55 g | 52 g | 72 g | 70 g | 87 g | 84 g |
| % of calories | 31% | 34% | 33% | 35% | 33% | 35% |
| Carbohydrate | 201 g | 176 g | 256 g | 231 g | 310 g | 284 g |
| % of RDA | 155% | 135% | 197% | 178% | 238% | 219% |
| % of calories | 50% | 51% | 51% | 52% | 52% | 52% |
| Calcium | 1215 mg | 331 mg | 1274 mg | 390 mg | 1377 mg | 493 mg |
| % of RDA | 101% | 28% | 127% | 39% | 138% | 49% |
| Iron | 14 mg | 14 mg | 17 mg | 16 mg | 21 mg | 21 mg |
| % of RDA | 181% | 177% | 93% | 91% | 266% | 262% |
| Magnesium | 311 mg | 251 mg | 352 mg | 292 mg | 420 mg | 360 mg |
| % of RDA | 97% | 78% | 114% | 94% | 105% | 90% |
| Phosphorus | 1585 mg | 889 mg | 1717 mg | 1021 mg | 1964 mg | 1268 mg |
| % of RDA | 226% | 127% | 245% | 146% | 281% | 181% |
| Potassium | 2863 mg | 2157 mg | 3348 mg | 2642 mg | 3799 mg | 3093 mg |
| % of AI | 61% | 46% | 71% | 56% | 81% | 66% |
| Sodium | 1570 mg | 965 mg | 1751 mg | 1146 mg | 2047 mg | 1442 mg |
| % of UL | 68% | 42% | 76% | 50% | 89% | 63% |
| Zinc | 13 mg | 10 mg | 14 mg | 11 mg | 17 mg | 14 mg |
| % of RDA | 165% | 122% | 178% | 135% | 155% | 124% |
| Vitamin A (in μg RAE) | 794 μg | 499 μg | 900 μg | 605 μg | 1025 μg | 730 μg |
| % of RDA | 113% | 71% | 129% | 86% | 114% | 81% |
| Vitamin E (in mg AT) | 8.2 mg | 8.0 mg | 10.2 mg | 10.1 mg | 12.0 mg | 11.9 mg |
| % of RDA | 54% | 54% | 68% | 67% | 80% | 79% |
| Vitamin D | 266 IU | 88 IU | 274 IU | 96 IU | 294 IU | 116 IU |
| % of RDA | 44% | 15% | 46% | 16% | 49% | 19% |
| Riboflavin | 1.9 mg | 1.0 mg | 2.1 mg | 1.2 mg | 2.4 mg | 1.5 mg |
| % of RDA | 174% | 95% | 191% | 111% | 184% | 116% |
| Vitamin B-12 | 6.5 μg | 4.1 μg | 6.9 μg | 4.4 μg | 7.9 μg | 5.4 μg |
| % of RDA | 273% | 169% | 287% | 183% | 327% | 224% |
| Choline | 311 mg | 237 mg | 348 mg | 275 mg | 402 mg | 329 mg |
| % of RDA | 73% | 56% | 82% | 65% | 73% | 60% |
| Cholesterol | 190 mg | 170 mg | 215 mg | 195 mg | 251 mg | 231 mg |
| % of goal (<300 mg/day) | 63% | 57% | 72% | 65% | 84% | 77% |
| Saturated Fatty Acids | 13.2 g | 11.5 g | 18.7 g | 17.1 g | 22.7 g | 21.0 g |
| % of calories | 7% | 8% | 8% | 9% | 8% | 9% |
| Monounsaturated Fatty Acids | 19.8 g | 19.0 g | 26.3 g | 25.5 g | 31.6 g | 30.8 g |
| % of calories | 11% | 13% | 12% | 13% | 12% | 13% |
| Polyunsaturated Fatty Acids | 17.8 g | 17.6 g | 22.5 g | 22.2 g | 26.7 g | 26.5 g |
| % of calories | 10% | 12% | 10% | 11% | 10% | 11% |
Data sources: NHANES 2009-2010 and NDB-SR26
Non-dairy Alternatives to Milk
A number of food sources of calcium, including non-dairy sources, were listed in the 2005 and 2010 Dietary Guidelines for Americans. To determine if any of these non-dairy calcium sources were comparable to the Dairy Group, the nutrient levels in non-dairy food sources were examined for all nutrients provided in substantial amounts by the Dairy Group. Only food sources with complete USDA nutrient data were considered in this analysis. Their nutrient levels were considered in two ways: First, the amounts of these nutrients in a standard amount of the food, such as 1 cup, ½ cup, or 3 ounces, which can be considered to be a typical portion size (Table 3). Second, the amounts of the foods that provided 300 mg of calcium, the amount in 1 cup equivalent from the Dairy Group, were calculated and levels of the other nutrients identified (Table 4).
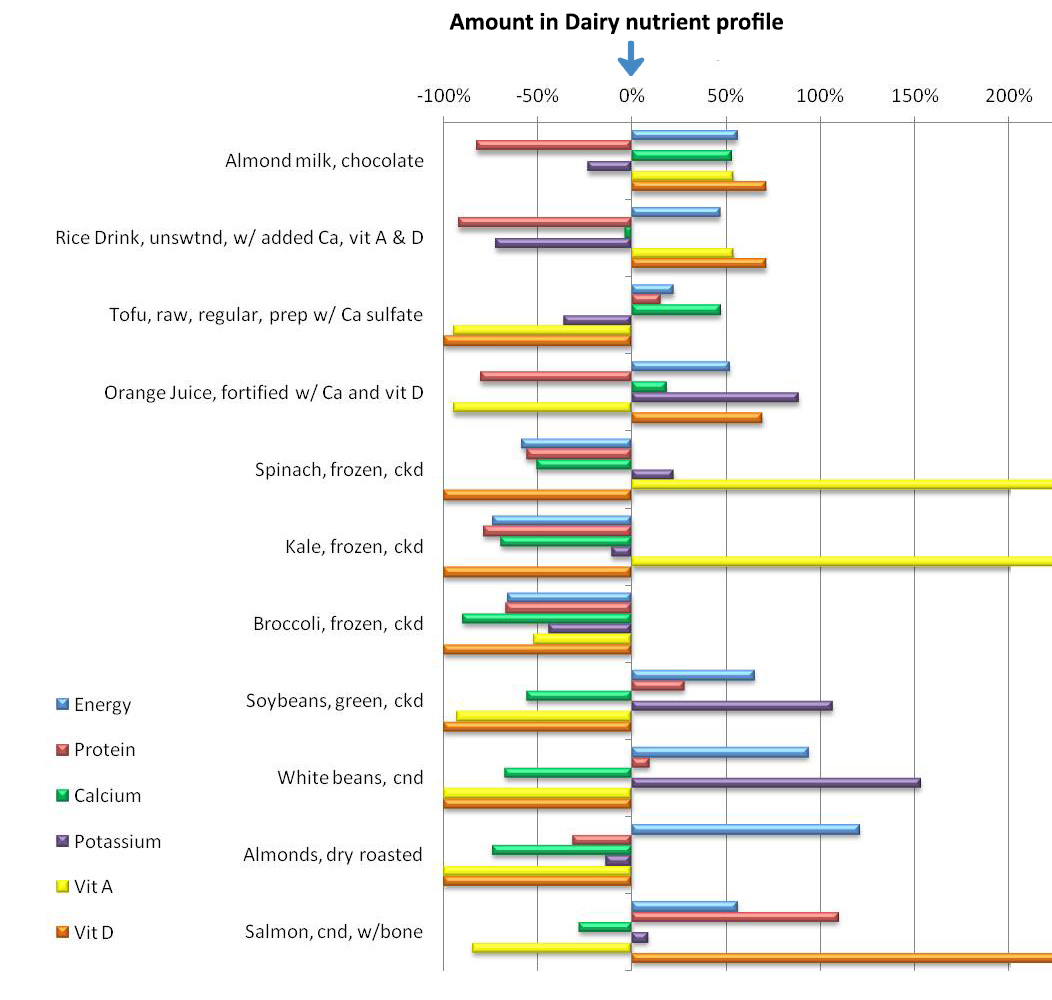
Non-dairy foods that provide a similar amount of calcium to milk within a typical portion size include calcium-fortified almond milk, calcium-fortified rice drink, calcium-fortified orange juice, and canned sardines with bones. All of these also provide ample amounts of magnesium in comparison to milk. Almond milk and rice drinks that are fortified with vitamins A and D in addition to calcium also provide ample amounts of those nutrients although are both low in potassium and protein when compared to milk. Fortified orange juice and sardines also provide potassium and vitamin D, but much less vitamin A. Some types of tofu provide calcium in amounts similar to milk, but the amount of calcium varies widely based on the firmness of the product and the salt (eg. calcium sulfate, magnesium chloride, calcium chloride) used to precipitate the tofu. All tofu provides at least some protein and potassium, but not vitamins A or D. In addition, all of the potential Dairy Group alternatives contain more calories than fat-free milk in a common portion except the soft tofu and dark green vegetables (collards, spinach, kale, and broccoli).
Table 3. Calcium and Selected Other Nutrients in Standard Amounts of the Dairy group and selected foods in the group, compared to and Non-Dairy Calcium Sources.
| Std Amt | Energy kcal | Protein g | Calcium mg | Magne-sium mg | Potas-sium mg | Vitamin A μg RAE | Vitamin D IU | |
|---|---|---|---|---|---|---|---|---|
| Selected foods in Dairy Group: | ||||||||
| Non-Dairy calcium sources: | ||||||||
| Dairy Group Profile | 1 cup equiv | 77 | 8.7 | 295 | 20 | 235 | 98 | 59 |
| Fat-free milk | 1 cup | 83 | 8.3 | 299 | 27 | 382 | 149 | 116 |
| Fat-free flavored yogurt (w/ low calorie sweetener) | 8 ounces | 97 | 8.8 | 324 | 29 | 401 | 5 | 107 |
| Fat-free mozzarella cheese | 1½ ounces | 60 | 13.5 | 408 | 14 | 45 | 54 | 0 |
| Soymilk, unswtnd, w/ added Ca, vit A & D* | 1 cup | 80 | 6.95 | 301 | 39 | 292 | 134 | 119 |
| Almond milk, chocolate | 1 cup | 120 | 1.51 | 451 | 29 | 180 | 151 | 101 |
| Rice Drink, unswtnd, w/ added Ca, vit A & D | 1 cup | 113 | 0.67 | 283 | 26 | 65 | 151 | 101 |
| Tofu, raw, regular, prep w/ Ca sulfate | 1/2 cup | 94 | 10.02 | 434 | 37 | 150 | 5 | 0 |
| Tofu, soft "silken", made with calcium chloride | 1/2 cup | 76 | 8.12 | 138 | 33 | 149 | 0 | 0 |
| Tofu, extra firm, prep w/ nigari (MgCl) | 1/2 cup | 113 | 12.26 | 217 | 66 | 164 | 0 | 0 |
| Tofu, firm, prep w/ Ca sulfate & MgCl | 1/2 cup | 88 | 10.32 | 253 | 47 | 186 | 0 | 0 |
| Orange Juice, fortified w/ Ca and vit D | 1 cup | 117 | 1.69 | 349 | 27 | 443 | 5 | 100 |
| Collards, frozen, ckd | 1/2 cup | 31 | 2.52 | 178 | 26 | 213 | 489 | 0 |
| Spinach, frozen, ckd | 1/2 cup | 32 | 3.81 | 145 | 78 | 287 | 573 | 0 |
| Kale, frozen, ckd | 1/2 cup | 20 | 1.85 | 90 | 12 | 209 | 478 | 0 |
| Broccoli, frozen, ckd | 1/2 cup | 26 | 2.85 | 30 | 12 | 131 | 47 | 0 |
| Soybeans, green, ckd | 1/2 cup | 127 | 11.12 | 130 | 54 | 485 | 7 | 0 |
| White beans, cnd | 1/2 cup | 149 | 9.51 | 96 | 67 | 595 | 0 | 0 |
| Almonds, dry roasted | 1 oz | 170 | 5.94 | 76 | 79 | 202 | 0 | 0 |
| Sardines, cnd, w/bone | 3 oz | 177 | 20.94 | 325 | 33 | 338 | 27 | 164 |
| Salmon, cnd, w/bone | 3 oz | 120 | 18.22 | 212 | 26 | 255 | 15 | 328 |
* Soymilk is part of Dairy Group. It is included in the table for comparison to other plant-based “milks.”
Data Source: USDA National Nutrient Database for Standard Reference, Release 26.
The second way in which these nondairy calcium alternatives were considered was in a portion that contained about 300 mg of calcium (Table 4). Amounts of almond milk, rice drink, and orange juice had similar amounts of calcium to milk in a portion size of 1 cup or less. The portion of tofu made with calcium sulfate was about 1/3 cup, sardines and salmon about 3 to 4 ounces, and cooked dark green vegetables from about 1 cup up to 5 cups. Almonds and white beans also had relatively large portion sizes. All of the alternatives except sweetened vanilla/chocolate almond milk, tofu made with calcium sulfate, orange juice, and the dark green leafy vegetables had energy content greater than that for fat-free milk in portions with similar calcium content. Vitamin D amounts were low in all alternatives except the fish with bones and vitamin D-fortified products. Vitamin A was low in all but the dark green vegetables and the vitamin A-fortified products. Potassium was equal to or higher than the amount in milk in all but the almond milk, rice drink, and some tofu.
Table 4. Amount of Non-Dairy Calcium Sources with Calcium Equivalent to 1 Cup Milk and Amount of Selected Other Nutrients in that Amount.
| Std Amt | Energy kcal | Protein g | Calcium mg | Magne-sium mg | Potas-sium mg | Vitamin A μg RAE | Vitamin D IU | |
|---|---|---|---|---|---|---|---|---|
| Dairy Group Profile | 1 cup equiv | 77 | 8.7 | 295 | 20 | 235 | 98 | 59 |
| Almond milk, chocolate | ~2/3 cup | 80 | 1.01 | 300 | 19 | 120 | 101 | 67 |
| Rice Drink, unswtnd, w/ added Ca, vit A & D | 1 cup | 113 | 0.67 | 283 | 26 | 65 | 151 | 101 |
| Tofu, raw, regular, prep w/ Ca sulfate | ~1/3 cup | 65 | 6.91 | 299 | 26 | 104 | 3 | 0 |
| Tofu, soft "silken", made with calcium chloride | ~1 cup | 165 | 17.71 | 300 | 73 | 324 | 0 | 0 |
| Tofu, extra firm, prep w/ nigari (MgCl) | ~2/3 cup | 156 | 16.91 | 299 | 91 | 226 | 0 | 0 |
| Tofu, firm, prep w/ Ca sulfate & MgCl | ~5/8 cup | 105 | 12.28 | 301 | 55 | 222 | 0 | 0 |
| Orange Juice, fortified w/ Ca and vit D | ~7/8 cup | 101 | 1.46 | 300 | 24 | 382 | 4 | 86 |
| Collards, frozen, ckd | ~7/8 cup | 51 | 4.22 | 298 | 43 | 356 | 816 | 0 |
| Spinach, frozen, ckd | 1 cup | 65 | 7.62 | 291 | 156 | 574 | 1146 | 0 |
| Kale, frozen, ckd | 1-2/3 cup | 65 | 6.17 | 300 | 39 | 697 | 1596 | 0 |
| Broccoli, frozen, ckd | 5 cup | 258 | 28.52 | 304 | 120 | 1306 | 469 | 0 |
| Soybeans, green, ckd | 1.1 cup | 279 | 24.45 | 287 | 119 | 1067 | 16 | 0 |
| White beans, cnd | 1.6 cup | 478 | 30.43 | 306 | 214 | 1903 | 0 | 0 |
| Almonds, dry roasted | 4 oz | 678 | 23.77 | 304 | 316 | 809 | 0 | 0 |
| Sardines, cnd, w/bone | 2.8 oz | 165 | 19.54 | 303 | 31 | 315 | 25 | 153 |
| Salmon, cnd, w/bone | 4.2 oz | 168 | 25.5 | 296 | 36 | 357 | 21 | 459 |
* Soymilk is part of Dairy Group. It is included in the table for comparison to other plant-based “milks.”
Data Source: USDA National Nutrient Database for Standard Reference, Release 26.
Considering that 3 cup equivalents from the Dairy Group is recommended for all individuals 9 and older, the amount of many potential alternatives to provide sufficient calcium would provide too many calories and/or be a large amount to consume daily. In addition, the question of bioavailability of the calcium in vegetable products has not been addressed and could pose a concern. However, there are several calcium- and vitamin D-fortified beverages that may be suitable alternatives to milk. Of these, the product most similar to milk is calcium–fortified soymilk which is identified as part of the Dairy Group. Calcium-fortified almond milk, rice drink, or orange juice are also alternatives to consider for calcium and some other nutrients, but they differ from milk in some potentially important nutrients (See Figure). Tofu made with calcium sulfate is also an option that offers many of the nutrients in milk, but not vitamins A or D. While it would not be typical for most American to consume sufficient sardines or canned salmon with bones on a regular basis to provide all the calcium needed, they do offer the advantage of also providing vitamin D in ample amounts. Some consumers could replace milk with a combination of these alternatives, for example, selecting a combination of calcium-fortified orange juice, collard greens, and canned salmon with bones.
Effect of Altering the Composition of the Dairy Group to Include More Milk and Less Cheese
The Dairy Group in current patterns is composed of nutrient-dense forms of milk, yogurt, and cheese in the same relative proportions as they appear in the average American diet: 53 percent milk, 45 percent cheese, and 2 percent yogurt. On a cup equivalent basis, milk is richer than cheese in a number of nutrients for which the Dairy Group is an important contributor. Thus, this analysis explored the effect on nutrient levels in the food patterns of increasing the proportion of milk relative to cheese. Current patterns were compared to patterns in which cheese was limited to 1 ounce per day, about 23% of the total Dairy recommendation in Patterns with 3 cup equivalents of Dairy. (A cup-equivalent of cheese is 1.5 ounces, so 1 ounce is 2/3 of a cup equivalent.) Proportions of milk, yogurt, and soymilk were all increased to 67%, 5%, and 5% respectively (Table 5).
Increasing the proportion of fat-free milk consumed to meet Dairy Group recommendations would increase levels of magnesium, potassium, vitamin A, vitamin D, and choline in the patterns, and decrease amounts of sodium, cholesterol and saturated fatty acids. It especially boosts levels of potassium and vitamin D, nutrients that are below intake goals in all patterns.
Table 5. Comparison of Selected Nutrient Levels (% of Goal and % of Calories) in USDA Food Patterns with less cheese and more milk, yogurt, and soymilk in the Dairy Group .
| Nutrient (Goal) | 1800 kcal Base Pattern1 | 1800 kcal Pattern with Less cheese2 | 1600 kcal Base Pattern1 | 1600 kcal Pattern with Less cheese2 |
|---|---|---|---|---|
| % of goal for F 14-18 | % of goal for F 13-18 | % of goal for F 51-70 | % of goal for F 51-70 | |
| Energy (kcal level) | 100 | 101 | 100 | 101 |
| Protein (≥ RDA) | 190 | 189 | 180 | 179 |
| Calcium (≥ RDA) | 97 | 98 | 101 | 102 |
| Magnesium (≥ RDA) | 94 | 98 | 97 | 101 |
| Potassium ≥ AI) | 67 | 72 | 61 | 66 |
| Vitamin A (≥ RDA) | 125 | 134 | 113 | 123 |
| Vitamin D (≥ RDA) | 45 | 56 | 44 | 56 |
| Choline (≥ AI) | 81 | 87 | 73 | 78 |
| Sodium (< UL) | 74 | 72 | 68 | 62 |
| Cholesterol (<300 mg/day) | 64 | 63 | 63 | 62 |
| % kcal | % kcal | % kcal | % kcal | |
| Protein | 18.2 | 19 | 21 | 20 |
| Carbohydrate | 51.2 | 53 | 50 | 52 |
| Total Lipid | 32.6 | 30 | 31 | 30 |
| Saturated Fatty Acids | 8 | 7 | 7 | 7 |
1 Base Pattern Dairy Group composition is 53% fat-free milk, 45% lowfat cheese, and 2% yogurt.
2 Less Cheese Dairy Group composition is 67% fat-free milk and 23% lowfat cheese, 5% yogurt, and 5% soymilk.
Data sources: NHANES 2009-2010 and NDB-SR26
Effect of substituting milk with sugar sweetened beverages on diet quality
The Dairy Group contributes to meeting many nutrients leading to higher diet quality. Table 6 illustrates how diet quality would be affected if one was to eliminate milk from the diet and replace it with soft drinks, fruit drinks, sports beverages, and other sugar sweetened beverages.
Table 6. Comparison of Selected Nutrient Levels (% of Goal and % of Calories) in Base USDA Food Pattern and Pattern Replacing Fluid Milk with Added Sugars
| Nutrient (Goal) | 1800 kcal Base Pattern1 | 1800 kcal Pattern with no fluid milk2 | 1600 kcal Base Pattern1 | 1600 kcal Pattern with no fluid milk2 |
|---|---|---|---|---|
| % of goal for F 14-18 | % of goal for F 13-18 | % of goal for F 51-70 | % of goal for F 51-70 | |
| Energy (1800, 2000 kcal) | 100% | 100% | 100% | 100% |
| Protein (≥ RDA) | 190% | 163% | 180% | 152% |
| Calcium (≥ RDA) | 97% | 61% | 101% | 62% |
| Magnesium (≥ RDA) | 94% | 82% | 97% | 83% |
| Potassium ≥ AI) | 70% | 54% | 61% | 48% |
| Vitamin A (≥ RDA) | 125% | 104% | 113% | 78% |
| Vitamin D (≥ RDA) | 45% | 16% | 44% | 16% |
| Choline (≥ AI) | 81% | 70% | 73% | 59% |
| Sodium (< UL) | 74% | 69% | 68% | 61% |
| Cholesterol (<300 mg/day) | 64% | 62% | 63% | 61% |
| % kcal | % kcal | % kcal | % kcal | |
| Protein | 19% | 17% | 21% | 18% |
| Carbohydrate | 52% | 55% | 50% | 54% |
| Total Lipid | 31% | 30% | 31% | 31% |
| Saturated Fatty Acids | 8% | 8% | 7% | 7% |
1 Base Pattern Dairy Group composition is 53% fat-free milk, 45% lowfat cheese, and 2% nonfat yogurt.
2 Replacing fluid milk with added sugars from sugar sweetened beverages.
Data sources: NHANES 2009-2010 and NDB-SR26
Lower intakes of calcium magnesium, potassium, Vitamin A, Vitamin D, choline and higher intakes of added sugars would decrease diet quality and place one further away from reaching nutrient recommendations.
Summary
The Dairy Group is a key contributor of calcium, vitamin D, phosphorus, vitamin A, riboflavin, vitamin B-12, potassium, and choline in the food patterns. If no milk products or alternative choices are consumed, calcium, magnesium, phosphorus, vitamin A, vitamin D, potassium, and choline are negatively impacted. Shortfalls relative to goals are largest for calcium, vitamin D, potassium, and choline. None of the alternatives to milk and milk products provide a similar enough nutrient profile in terms of these impacted nutrients to be considered for inclusion in the Dairy Group. However, alternative calcium choices could be selected in combinations that together provide the range of nutrients needed.
While all foods in the Dairy group provide calcium and the other nutrients of interest, some tend to have lower levels of desired nutrients and/or higher levels of sodium and saturated fat. Selecting more of the recommended 3 cup equivalents per day from fluid lowfat or fat-free milk than the current proportions consumed, and less from cheese, would provide more potassium, vitamin A, vitamin D, and choline in the patterns, and decrease amounts of sodium, cholesterol and saturated fatty acids.
Substituting sugar-sweetened beverages for the amounts of fluid milk in the patterns would lead to decreased diet quality and leave one further from meeting nutrient recommendations.
References
1. DietaryGuidelines.gov (2014). Usual intake distributions, 2007-10 by age/gender groups. Retrieved from DietaryGuidelines.gov: http://www.health.gov/dietaryguidelines/2015-BINDER/meeting2/docs/refMaterials/Usual_Intake_072013.pdf [PDF - 1 MB]
2. Center for Nutrition Policy and Promotion (2014). Nutrient Content of the U.S. Food Supply, 1909-2010. Available from Center for Nutrition Policy and Promotion Web site: https://www.fns.usda.gov/cnpp/us-food-supply-1909-2010
3. U.S. Department of Agriculture and U.S. Department of Health and Human Services. Dietary Guidelines for Americans, 2010. 7th Edition, Washington, DC: U.S. Government Printing Office, December 2010.
Figure. Percent difference from Dairy nutrient profile in selected nutrient amounts for some potential calcium alternatives. Nutrient amounts are in a standard portion size, as listed on Table 3. The 0% line reflects amount in Dairy nutrient profile. Negative percents indicate amounts less than in the Dairy profile, positive percents amounts greater than the Dairy profile. (Graph is truncated at 200%.)
NOTE: Nutrient levels in the base USDA Food Patterns are in the Adequacy of the USDA Food Patterns modeling report, additional materials, Tables E3.1.A6 and E3.1.A7.
Table A1. Nutrient Levels in USDA Food Patterns with Milk Group Removed, compared to goals for each pattern.
Table A1 Page 1
Table A1 Page 2
Table A1 Page 3