Research Question
How well do updated USDA food intake patterns meet IOM Dietary Reference Intakes and 2010 Dietary Guidelines nutrient recommendations? How do the recommended amounts of food groups compare to current distributions of usual intakes for the American population?
Background
Overview
The USDA Food Patterns are intended to represent the types and amounts of foods that will provide nutrients sufficient to meet IOM nutrient recommendations and Dietary Guidelines for Americans recommendations. They are updated every five years during the deliberations of the Dietary Guidelines Advisory Committee, and are presented to the Committee for their assessment of the Patterns’ adequacy. As part of the update, amounts recommended from each food group may be modified to reach all or most of the specified goals. In addition, the amounts from each food group are compared to usual dietary intake patterns of the U.S. population, and kept within the normal range of consumption.
History of the USDA food patterns
Food guides describe the types and amounts of food to consume. Over the past century, USDA has developed a number of different food guides to identify patterns of eating that would meet known nutrient needs and balance intake from various food groups. Many of the earlier food guides focused on nutrient adequacy only and were designed to meet known nutrient needs at the time. Beginning in the late 1970s, recommendations for dietary moderation to help prevent chronic disease were issued. A need was recognized for a food guide that made food intake suggestions for a “total diet” rather than a “foundation diet” in order to encompass goals for moderation as well as adequacy.
The first USDA Food Patterns that represented a “total diet” approach to food guides were developed in the mid-1980s and, starting in 1992, presented as the Food Guide Pyramid. From 2002 to 2005, the USDA Food Patterns underwent a major revision to meet the newly released IOM Dietary Reference Intakes and were included in the 2005 Dietary Guidelines. The patterns were also updated using the same process for the 2010 Dietary Guidelines. The current USDA Food Patternsxii, showing recommended amounts or limits from each food group, are listed in Table E-3.1.A1xiii.
General process for developing and updating the USDA food intake patterns
The overall iterative process used to develop and update the USDA Food Patterns includes (1) identifying appropriate energy levels for the patterns, (2) identifying nutritional goals for the patterns, (3) establishing food groupings, (4) determining the amounts of nutrients that would be obtained by consuming various foods within each group, and (5) evaluating nutrient levels in each pattern against nutritional goals. Each is described briefly here.
- Establish Energy Levels. IOM Dietary Reference Intakes formulas are used to calculate Estimated Energy Requirements (EER) for various age/sex groups within the population. These formulas are based on sex, age, height, weight, and physical activity level. Median heights and weights at healthy BMIs are used to calculate appropriate energy levels for the patterns. A range of energy levels from 1000 to 3200 calories was found to meet the needs of most of the population. Within this range, patterns at 12 energy levels (each 200 calorie “step”) have been established. There have been no changes to the EERs since they were released in 2002, so energy levels for each age/sex group have not changed.
- Establish Nutritional Goals. Specific nutritional goals for each food intake pattern are selected based on the age/sex group(s) for which it is targeted. If a food intake pattern is targeted for more than one age/sex group, the pattern is evaluated against the nutrient goals for all those groups. Goals for energy, 12 vitamins, 9 minerals, 3 macronutrients, 3 fatty acids, cholesterol, and fiber are based on IOM DRI reports released between 1997 and 2010 and on quantitative recommendations in the current Dietary Guidelines. Because the Food Patterns are designed as plans for individuals to follow, the goals are the RDA amounts for nutrients having an RDA. The lowest energy level assigned to each age/sex group (for less active/sedentary individuals) is used in evaluating the patterns against nutritional goals.
- Establish Food Groupings. Food groups and subgroups are reviewed to identify where changes might be needed to reflect the current Dietary Guidelines. For example, to meet 2010 DGA recommendations for seafood intakes, subgroups within the Protein Foods group were identified in the 2010 Food Patterns. In addition, while fats are not technically considered to be food group, they are a component of the patterns. To distinguish between fats that are primarily sources of saturated fatty acids and those that are primarily sources of mono- or poly-unsaturated fatty acids, in the 2005 revision fats were separated into subcategories of “solid fats” and “oils.”
- Identify Nutrient Contributions from Each Food Group. A “composite” system is used to determine the expected nutrient content of each food group. Mixed foods are disaggregated into their ingredients, and similar ingredients are aggregated into item clusters (see Figures 1 and 2). The proportional intake of each item cluster within each food group or subgroup is calculated, and a nutrient-dense form of the food is selected as the representative food for each cluster. For example, the red-orange vegetable subgroup has 12 item clusters, including cooked carrots, raw carrots, cooked tomatoes, and raw tomatoes. While cooked carrots may be consumed in many forms, plain cooked carrots are selected as the representative food for this cluster. Using the nutrients in each representative food and the item cluster’s proportional intake, a nutrient profile is calculated for each food group or subgroup. Nutrient profiles are also calculated for oils and solid fats using food supply data to determine proportional intakes.
Figure 1. Example of disaggregation of a mixed food into item clusters
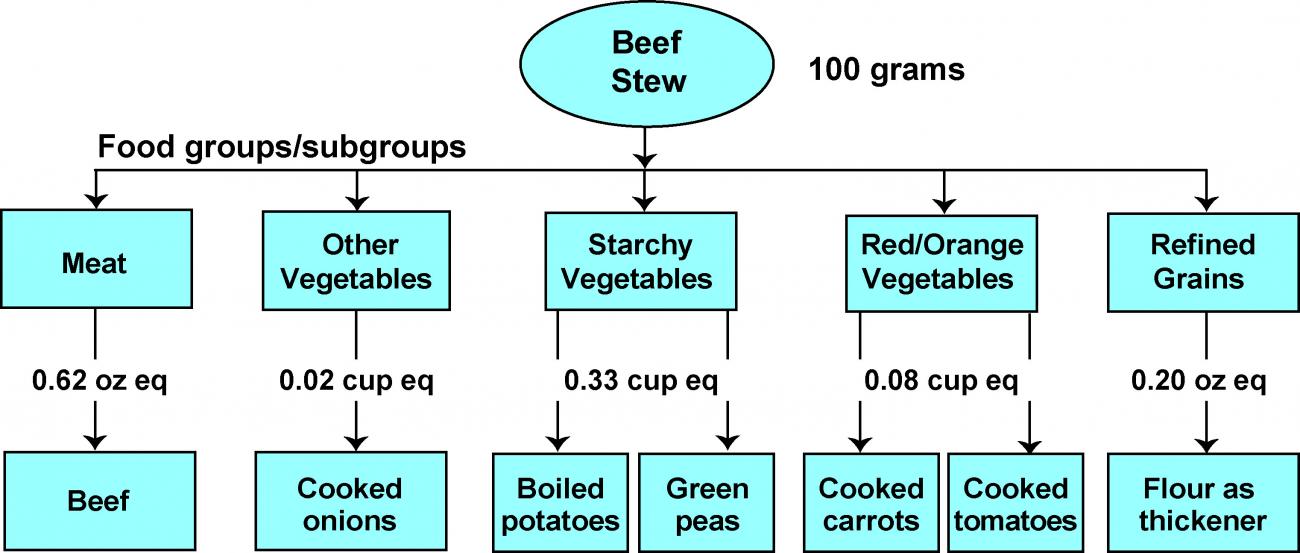
Figure 2. Example of aggregation of an item cluster from various foods
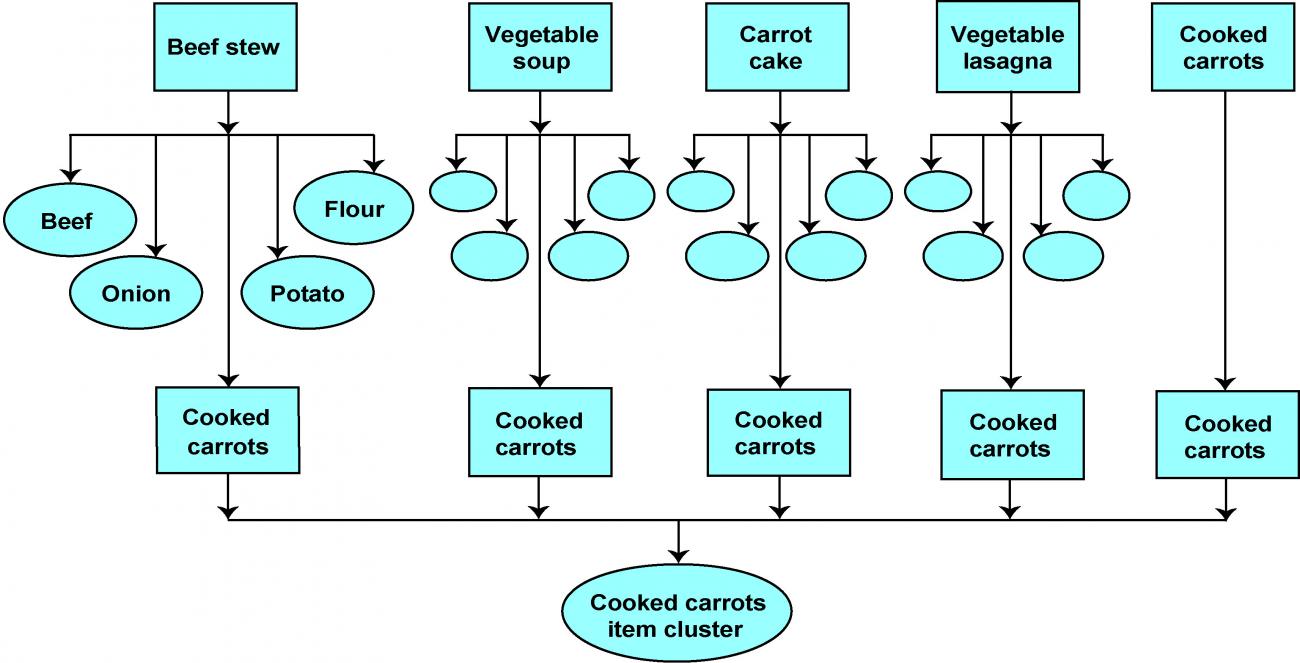
Figures 1 and 2 adapted from Marcoe et al, 2006.
- Determine Recommended Amounts from Each Food Group. Using the updated nutrient profiles, the nutrients provided by currently recommended amounts from each food group (and oils) are compared to the pattern’s goals. Iterative changes to food group amounts are made when needed until each pattern achieves its nutritional goals or comes within a reasonable range (usually at least 90% of the RDA or AI). Any nutrient goals that are not feasible to meet within the structure of the food patterns are identified and potential health impacts are considered by the Dietary Guidelines Advisory Committee.
In the initial development of the food patterns, food group amounts were modified based on a judgment of which food groups could most reasonably provide the nutrients when goals were not met. All necessary increases are balanced with energy compensating decreases in other food groups. To reduce possible bias in modifying food group amounts, these amounts are now evaluated against usual intake distributions and limited to amounts between median and 95th percentiles of usual intakes, or in the case of overconsumed components, between the median and the 5th percentiles of usual intake. Calories from all food groups and oils, termed “essential calories,” are then summed and the remaining calories up to the calorie limit for the pattern are used to set a limit for calories from solid fats and added sugars.
Methods (specific methods for this analysis)
The rationale for the current analysis is to determine if the USDA food patterns, as presented in the 2010 Dietary Guidelines, but with updated nutrient profiles for each food group, based on more recent food consumption and nutrient composition data, continue to meet nutritional goals for adequacy and moderation while staying within the established calorie targets.
- Assigned all foods reported in the What We Eat in America/National Health and Nutrition Examination Survey (WWEIA NHANES) 2009-10 to appropriate item clusters. Item cluster assignment was based on the type of food, using the food description or recipe. Mixed dishes were disaggregated into single ingredients and each ingredient was assigned to an item cluster. Table 1 lists the number of item clusters for each food group or subgroup. Table E3.1.A2 lists all of the current item clusters and representative foods for the USDA food patterns.
Table 1. Number of item clusters in the current analysis and food pattern update, using WWEIA/NHANES 2009-10 food intake data.
| Food Group | Subgroup | Number of Clusters | Number of Representative Foods |
| Dairy | 691 | 11 | |
| Fruits | 121 | 85 | |
Vegetables
| Dark Green | 19 | 18 |
| Red/Orange | 12 | 11 | |
| Starchy | 14 | 14 | |
| Legumes | 11 | 10 | |
| Other | 38 | 37 | |
Grains
| Whole | 15 | 14 |
| Refined | 20 | 17 | |
Protein Foods
| Meats | 10 | 10 |
| Poultry | 3 | 3 | |
| Seafood (high n3) | 13 | 13 | |
| Seafood (low n3) | 32 | 29 | |
| Eggs | 1 | 1 | |
| Nuts/Seeds | 17 | 17 | |
| Processed Soy Products | 2 | 2 |
1 The large number of clusters in the milk group was developed to provide a description of how milk products are consumed, in addition to use in calculating a nutrient profile. Many clusters are represented by the same nutrient-dense form of milk, cheese, or yogurt.
- Selected a representative food in a nutrient-dense form for each item cluster. A representative food (See E3.1.A2) for each item cluster was selected from those available in the National Nutrient Database for Standard Reference, Release 26 (NDB-SR26). To the extent possible, they are forms of the foods that are lean, fat-free, or low-fat, with no added sugars or sodium. They are intended to be widely available in the marketplace. In a few cases, a food with some added salt, fat, or sugars was selected when an appropriate product low in all three was not in the database. For example, the cheeses selected as the most nutrient-dense choices are low in fat, but not necessarily low in sodium, and the ice cream selected is fat-free, but contains a small amount of added sugars. Because we wanted foods that people might realistically substitute for their typical choices, foods designed for special diets and not widely available, such as low sodium breads, were not used as representative foods. In all, of the 292 representative foods, about 13% contain some added salt and about 7% contain some added sugars. Among those with added salt, about half are bread and cereal products; others include processed and cured meats, canned fish (tuna, sardines), peanut butter, cheeses, olives, low-sodium pickles, and fat-free potato chips. Those with added sugars include some bread and cereal products, cranberry sauce, dried cranberries, and ice cream.
- Calculated nutrient profiles for each food group or subgroup using the nutrient data for representative foods and the proportional consumption of each item cluster from the food group composite. Nutrient data for each representative food was obtained from NDB-SR26. Proportional consumption (Table E3.1.A2) was calculated from WWEIA/NHANES 2009-10. The updated Food Patterns Equivalent Database (FPED) was used to convert nutrients per 100 grams to nutrients per cup or ounce equivalent. The nutrient profiles for the fruit and dairy groups are calculated as a food group profile. The profiles for the vegetable, grain, and protein foods groups are calculated for subgroups within the overall food group. Subgroups are identified in Table 1. Updated nutrient profiles were also calculated for oils and solid fats using 2010 Food Availability data from ERS and nutrient data for representative oils and fats from SR26. Food supply data is used because NHANES does not specify the type of oil or solid fat for most foods, and cannot be used to determine proportional consumption. Nutrient values for granulated sugar are used for added sugars component of the food patterns—no profile is calculated. The nutrients included in the nutrient profile calculations are listed in Table 2.
Table 2. Nutrients included in food patterns analysis.
| Vitamins | Minerals | Macronutrients and fatty acids | Other |
|---|---|---|---|
Vitamin A* Vitamin E Vitamin D Vitamin C Thiamin Riboflavin Niacin Vitamin B-6 Vitamin B-12 Choline Vitamin K Total Folate | Calcium Iron Magnesium Manganese Phosphorus Potassium Sodium Zinc Copper Selenium | Protein Carbohydrate Total lipid (fat)
| Energy Cholesterol Fiber, total dietary |
*Includes vitamin A precursors
- Compared existing recommended intake amounts for each food group and energy levels for the patterns to usual intake distributions. One new goal for the update was to keep the amounts from all food groups and subgroups within the limits of the 5th and 95th percentiles of usual intake for each age and sex group. The amounts for each food group were compared to usual intake distributions from the NCI analysis of WEIA/NHANES 2007-10 dietary intakes. For under-consumed food groups and dietary components, recommended amounts were compared to the median and 95th percentiles of intakes. For over-consumed food groups and dietary components, recommended amounts were compared to the 5th percentile and median intake levels.
- Calculated calories and nutrients provided by each pattern from nutrient profiles and recommended intake amounts. The sum of calories from the food groups and oils were considered “essential calories,” and a limit for calories from solid fats and added sugars was calculated by subtracting essential calories from the caloric goal for the pattern. The calories from solid fats and added sugars were apportioned based on the proportional intakes of solid fats and added sugars in the population, using the NCI analysis of usual intakes for WWEIA/NHANES 2007-10. This partitioning allowed for calculation of the amounts and proportions of fatty acids and carbohydrates in the overall patterns, and suggested limits for solid fats and added sugars intakes.
- Compared nutrients in each pattern with nutrient recommendations and identified nutritional goals that were met or not met for age/sex groups at each calorie level. Each age/sex group was assigned to an intake pattern at a specific calorie level that should meet their energy needs to maintain weight, assuming an average height and weight within the healthy weight range. Table E3.1.A3 lists the assignment of age/sex groups to food patterns. Each pattern was compared to the nutrient goals for that pattern, from the most recent DRIs or in some cases the 2010 Dietary Guidelines. Table E3.1.A4 lists the specific nutrient goals for each pattern. For this evaluation, the pattern selected was at an energy level appropriate for sedentary (less active) individuals within the age/sex group. If this pattern met nutrient goals for adequacy, patterns at higher calorie levels (for more physically active individuals) would also meet those goals.
Results
Food Group Nutrient Profiles
Nutrient profiles were developed that provide the calorie and nutrient content for a standard amount of food from each food group or subgroup. They are based on the weighted average nutrient content of a cup or ounce equivalent of all representative foods within the group. Table 3 shows the selected nutrients in each food group nutrient profile for the current patterns. Complete nutrient profiles for the 2015 patterns are shown in Table E-3.1.A5.
Table 3. Selected nutrients in 2015 food group nutrient profiles
| Food Group/subgroup | Potassium (mg) | Calcium (mg) | Vitamin D (IU) | Fiber (g) | Sodium (mg) |
|---|---|---|---|---|---|
| Dairy (per cup eq) | 235 | 295 | 59 | 0.2 | 202 |
| Fruits (per cup eq) | 311 | 19 | 0 | 2.3 | 4 |
| Vegetables (per cup eq) | |||||
| Dark Green | 377 | 75 | 0 | 3.3 | 46 |
| Red/Orange | 443 | 24 | 0 | 2.4 | 34 |
| Starchy | 604 | 17 | 0 | 3.7 | 74 |
| Legumes | 739 | 83 | 0 | 15.4 | 3 |
| Other | 266 | 38 | 0.5 | 2.6 | 30 |
| Grains (per oz eq) | |||||
| Whole | 94 | 44 | 6 | 2.4 | 84 |
| Refined | 33 | 29 | 1 | 0.8 | 101 |
| Protein Foods (per oz eq) | |||||
| Meats | 93 | 2 | 4 | 0 | 127 |
| Poultry | 76 | 4 | 1 | 0 | 59 |
| Seafood (high n3) | 104 | 8 | 99 | 0 | 41 |
| Seafood (low n3) | 82 | 14 | 20 | 0 | 118 |
| Eggs | 63 | 25 | 44 | 0 | 62 |
| Nuts/seeds | 96 | 13 | 0 | 1.2 | 20 |
| Processed Soy Products | 27 | 45 | 0 | 0.8 | 116 |
| Oils (per gram) | 0.01 | 0.01 | 0 | 0 | 0.18 |
| Solid Fats (per gram) | 0.07 | 0.06 | 0.3 | 0 | 1.73 |
The nutrient profiles of each food group have changed over time for several reasons. First, the nutrients for representative foods may have been updated by the NDL. Second, a new food may have been selected as the representative food for an item cluster if it was a more nutrient-dense choice and still was an appropriate food to represent the item cluster. Third, the Food Pattern Equivalents for the representative food may have changed, due to a new streamlined system for calculating equivalents that has been put into place. Finally, the relative consumption of various item clusters within the food group may have changed, so that more weight was given to different foods within the group. Table 4 compares the energy content of each 2015 food group or subgroup with the energy content of comparable groups in 2005 and 2010.
Table 4. Comparison of calories in 2005, 2010, and 2015 food group nutrient profiles.
| Food Group/subgroup | 2005 Food Patterns Calories | 2010 Food Patterns Calories | 2015 Food Patterns Calories |
|---|---|---|---|
| Dairy (per cup eq) | 83 | 81 | 77 |
| Fruits (per cup eq) | 118 | 101 | 98 |
| Vegetables (per cup eq) | |||
| Dark Green | 40 | 36 | 33 |
| Red/Orange | 64 (orange) | 48 (red/orange) | 43 (red/orange) |
| Starchy | 146 | 183 | 179 |
| Legumes | 228 | 242 | 243 |
| Other | 35 | 48 | 48 |
| Grains (per oz eq) | |||
| Whole | 77 | 89 | 92 |
| Refined | 83 | 81 | 85 |
| Protein Foods (per oz eq) | 54 | ||
| Meats | 49 | 49 | |
| Poultry | 50 | 51 | |
| Seafood (high n3) | 51 | 53 | |
| Seafood (low n3) | 33 | 31 | |
| Eggs | 78 | 78 | |
| Nuts/seeds | 87 | 87 | |
| Processed Soy Products | 49 | 47 | |
| Oils (per gram) | 8.6 | 8.8 | |
| Solid fats (per gram) | 8.1 | 8.4 |
Calories in the food patterns
For all food patterns, when using the nutrients and calories from representative foods that are in nutrient-dense forms, the sum of the calories from recommended amounts of each food group and oils (“essential calories”) was less than the caloric goal for the pattern. The remaining calories are assigned to a maximum limit for calories from solid fats and added sugars, as shown in Table 5. Table 5 also identifies how the limit was apportioned between amounts of solid fats and added sugars, for the purpose of calculating macronutrient proportions.
The allowable calories from solid fats and added sugars are very low in patterns at lower caloric levels, and in patterns at 1200 to1600 calories even lower than the 1000 calorie pattern. The patterns at 1200 and 1400 calories level are targeted to meet the nutrient needs of children 4 to 8 years old, and include 2.5 cups from the Dairy group in order to meet their RDA for calcium. The 1600 calorie pattern contains 3 cups from the Dairy group in order to meet the RDA for calcium of children older than 8 and older adult women. In contrast, the 1000 calorie pattern contains only 2 cups from the Dairy group in order to meet the lower calcium RDA for 2 year olds, and smaller amounts from other food groups due to other lower nutrient requirements. This is the reason for the larger allowance for solid fats and added sugars in the 1000 calorie pattern than in the 1200 to 1600 calorie patterns.
Table 5. Essential calories and limit on calories from solid fats and added sugars in each pattern and the amounts of solid fats and added sugars used in analysis of the pattern.
| Calorie Level | Essential Calories1 | Calorie Limit for solid fats and added sugars2 | Calories assigned to Solid Fats3 | Calories assigned to Added Sugars3 | Grams of Solid Fats4 | Grams of Added Sugars4 |
|---|---|---|---|---|---|---|
| 1000 | 850 | 152 | 84 | 68 | 10 | 17 |
| 1200 | 1097 | 107 | 59 | 48 | 7 | 12 |
| 1400 | 1288 | 111 | 59 | 52 | 7 | 13 |
| 1600 | 1471 | 123 | 67 | 56 | 8 | 14 |
| 1800 | 1629 | 168 | 92 | 76 | 11 | 19 |
| 2000 | 1732 | 271 | 151 | 120 | 18 | 30 |
| 2200 | 1919 | 279 | 151 | 128 | 18 | 32 |
| 2400 | 2051 | 349 | 193 | 156 | 23 | 39 |
| 2600 | 2221 | 382 | 210 | 172 | 25 | 43 |
| 2800 | 2402 | 398 | 218 | 180 | 26 | 45 |
| 3000 | 2528 | 472 | 260 | 212 | 31 | 53 |
| 3200 | 2589 | 612 | 336 | 276 | 40 | 69 |
1 Calories in pattern if all foods are consumed in nutrient-dense forms, without additional solid fats or added sugars.
2 Calculated from pattern calorie level minus essential calories.
3 Calculated as 55% of calories from solid fats and 45% from added sugars, based on mean population intakes (NCI Usual Intakes data for NHANES 2007-10).
4 Calculated using caloric values of 8.4 kcal per 1 gram of solid fats and 4 kcal per gram of added sugars.
Recommended amounts in comparison to usual intake distributions
The intake amounts from each food group or subgroup and oils were compared to the median and either the 5th or 95th percentile of usual intake for WWEIA/NHANES 2007-10. For under-consumed food groups, recommended intake amounts are generally between the median and 95th percentiles of usual intake, though for some specific food groups and age/sex groups amounts may be somewhat above the 95th percentile of intake.
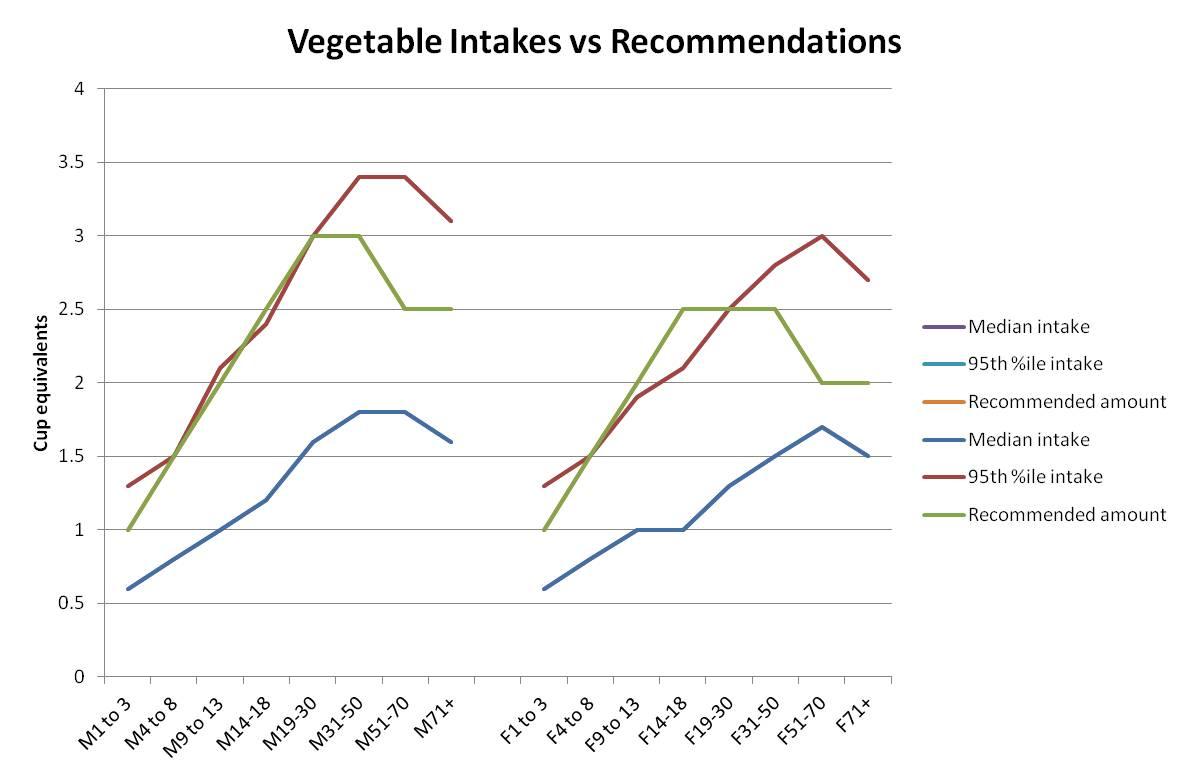
Figure 3 shows a sample comparison of recommendations to usual intakes for vegetables. Recommended vegetable intakes are above the 95th percentile for girls 9 to 13 and 14 to 18. Intakes for most males up to the age of 30 are at the 95th percentile. The graph shows that usual intakes of vegetables are higher in older men and women, while due to lower calorie needs the recommended amounts drop with age. In all cases, recommended intake of vegetables are above the median intake levels.
Figure 3. Recommended amounts of vegetables in the 2015 USDA Food Patterns, in comparison to usual intakes by age/sex groups in the 2007-2010 WWEIA/NHANES.
A comparison of the recommended amounts to usual intake percentiles for all food groups and subgroups were made using the recommended amounts from the Food Patterns and the usual intake distributions for WWEIA/NHANES 2007-10 from the National Cancer Institutexiv. Recommended intakes are generally between the median and the 95th percentile of intake for total vegetables, total fruit, and dairy intake. For these food groups, exceptions are that recommendations exceed the 95th percentile in these cases: vegetables for girls 9 to 18, fruits for men and women 19 to 30, and dairy for women over 30. Total protein food recommendations approximate median intakes for many age/sex groups, but are lower than the median for men 19 and older and are somewhat above the median (but below the 95th percentile) for girls 9 to 18 and women 19 to 30. Whole grain recommendations are well above the 95th percentile for all age/sex groups, and refined grain recommendations are about the 5th percentile of intake for most age/sex groups.
Recommended intake of vegetable subgroups (dark green, red/orange, starchy, beans and peas, and other) and seafood were also compared to usual intake distributions. Recommended amounts for all vegetable subgroups except other vegetables fall between the median and the 95th percentile for most age/sex groups, and exceed the 95th percentile for a few age/sex groups—most commonly for teen boys and young men. Recommendations for the other vegetable subgroup fall slightly below median intakes for men and women 51 to 70. Recommended seafood intakes are above the 95th percentile intakes for boys 4 to 18 and girls 2 to 18, and between the median and 95th percentile intakes for adults.
Recommendations for oils fall between the median and 95th percentile of intakes for all age/sex groups. Both solid fat and added sugars limits approximate the 5th percentile of intake, but are less than the 5th percentile for boys and girls 2 to 13.
Nutrients in food patterns
The 12 USDA food patterns meet almost all of their nutritional goals for adequacy. Table 6 presents selected findings. See Figure 4 for a summary of the nutrients provided by the patterns in comparison to nutrient goals, Table E3.1.A6 for levels of all nutrients provided by each pattern, and Table E-3.1.A7 for a comparison of the nutrients in all patterns to all nutrient goals.
As shown in Figure 4, for many nutrients,, amounts of a nutrient in the patterns are well above the RDA or AI. Protein, phosphorus, zinc, copper, selenium, manganese, vitamin C, thiamin, riboflavin, niacin, vitamin K, folate, vitamin B6, and vitamin B12are above the goal amounts for all age/sex groups.
In contrast, some nutrients are just above the RDA or AI, or marginally below (90 to 100% of goal) goal amounts for several age/sex groups. For example, amounts of calcium in the patterns are marginal for children ages 4 to 8 (98% RDA), 9 to 13 (97% RDA), and girls 14-18 (97% RDA). Amounts of iron are marginal for women 19-50 (91-93% RDA), and magnesium is marginal for girls 14-18 (94% RDA) and women over 50 (97% RDA). In addition, magnesium is low for men over 50 (84% RDA). Note that percents of the RDA shown are for the lowest calorie level assigned to these age/sex groups—the level applicable for a sedentary/less active physical activity level. In comparison to EARs, which are the appropriate targets for assessment of adequate intakes in populations, amounts in all patterns meet the EARs for calcium, iron, and magnesium. However, no patterns meet the EAR for vitamin D.
Figure 4. Range of nutrient levels in USDA Food Patterns across all age/sex groups, expressed as a percent of nutritional goal for each group. Bars show the lowest to highest percentage of the RDA or AI met by the USDA Food Patterns for each nutrient for any age/sex group.
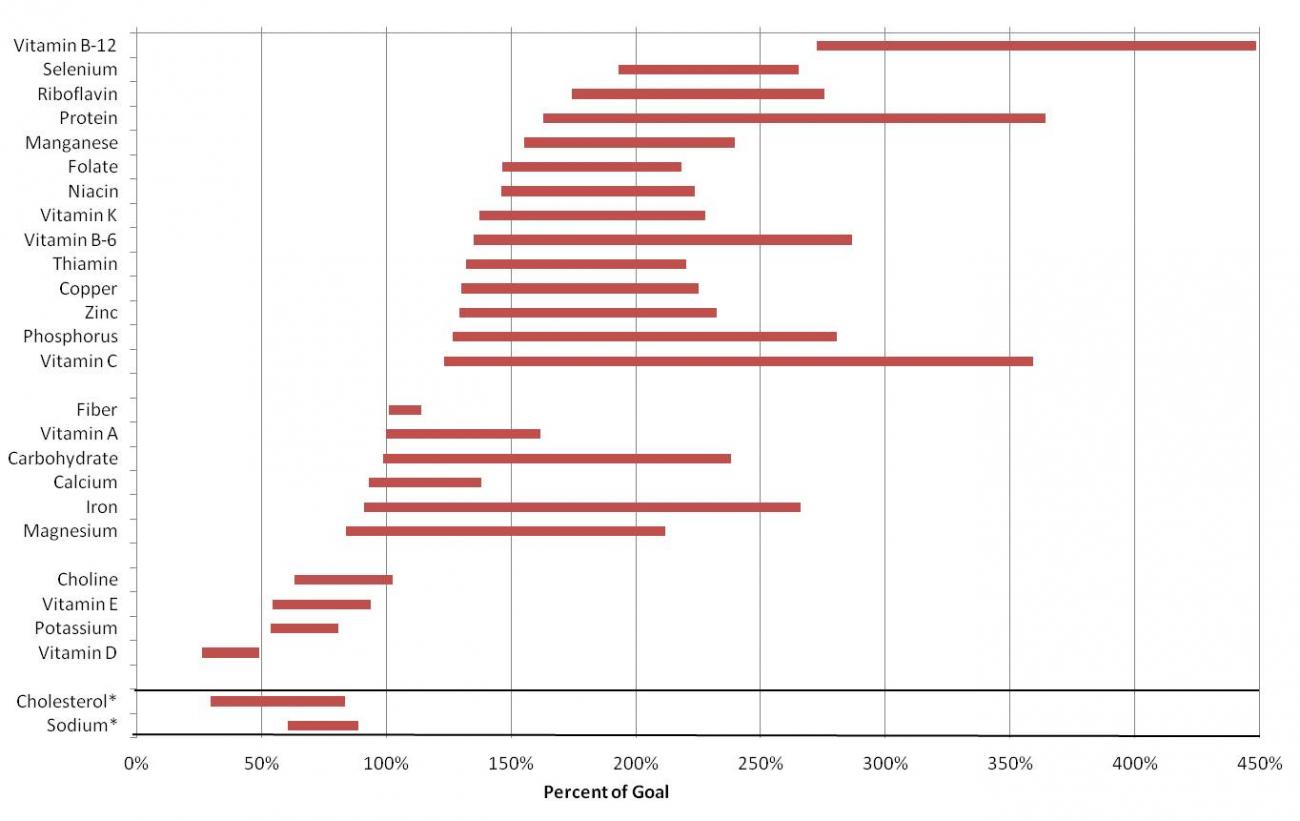
*For cholesterol, bar shows percent of 300 mg. For sodium, the bar shows the percent of UL.
The nutrients for which adequacy goals are not met in almost all patterns are potassium, vitamin D, vitamin E, and choline. Potassium levels are less than 90% the AI in the patterns up through 2600 calories. Vitamin D amounts in the patterns range from 26% to 52% of the RDA. Vitamin E amounts are low for most age/sex groups except for active teen boys and men needing 2800 calories or more. Choline amounts range from 63% to 86% of the AI.
The nutrients that were well above, at, or marginally below, and below the RDA or AI are the same as in 2010. Due to the new higher RDA for vitamin D, amounts in the patterns are a much smaller percentage of the RDA than previously. To meet vitamin D recommendations while following the food group recommendations of the USDA Food Patterns, careful selection of specific foods within each food group would be needed, to include natural sources of D and foods fortified with D every day.
The patterns also meet almost all of their nutrient goals for moderation. The patterns at the three highest calorie levels (2800 to 3200 kcal) have more than the UL for sodium of 2300 mg (2345 to 2392 mg). In addition, all patterns are above the sodium AI for the age/sex group for which they are targeted. Only the patterns from 1000 to 1400 calories, designed for children 8 and younger, have less than 1500 mg of sodium. Saturated fat ranges from 7% to 9% of calories, with patterns at most calorie levels at 8% of calories. The 3200 calorie pattern is above the 35% of calories from fat upper boundary, with 36% of calories from fat. All other moderation goals are met. The moderation goals that were met or not met are also the same as in 2010.
Table 6. Selected nutrients in selected food patterns and comparison to goals for targeted age/sex group.
| Calorie Level of Pattern | 1000 | 1200 | 1800 | 1600 | 2000 | 2400 |
| Target age/sex group | M/F 2-3 | F 4-8 | F 14-18 | F 51-70 | F 19-30 | M 19-30 |
| Macronutrients | ||||||
| Protein | 44g | 59 g | 87g | 83 g | 91 g | 106 g |
| % of RDA | 337% | 311% | 190% | 180% | 198% | 189% |
| % of calories | 18% | 20% | 19% | 21% | 18% | 18% |
| Total lipid (fat) | 37g | 41 g | 61g | 55 g | 72 g | 87g |
| % of calories | 33% | 31% | 31% | 31% | 33% | 33% |
| Carbohydrate | 129g | 155 g | 233g | 201 g | 256 g | 310 g |
| % of RDA | 99% | 119% | 179% | 154% | 197% | 238% |
| % of calories | 51% | 52% | 52% | 50% | 51% | 52% |
| Fiber, total dietary | 14g | 18 g | 29g | 25 g | 31 g | 37 g |
| % of goal (14 g/1000 kcal) | 101% | 107% | 114% | 113% | 109% | 111% |
| Minerals | ||||||
| Calcium | 768mg | 975 mg | 1260mg | 1215 mg | 1274 mg | 1377 mg |
| % of RDA | 110% | 98% | 97% | 101% | 127% | 138% |
| Iron | 8 mg | 10 mg | 16 mg | 14 mg | 17 mg | 21 mg |
| % of RDA | 110% | 104% | 109% | 180% | 93% | 265% |
| Magnesium | 169 mg | 223 mg | 337 mg | 311 mg | 352 mg | 420 mg |
| % of RDA | 212% | 172% | 94% | 97% | 114% | 105% |
| Potassium | 1611mg | 2102 mg | 3149mg | 2863 mg | 3348 mg | 3798 mg |
| % of AI | 54% | 55% | 67% | 61% | 71% | 81% |
| Sodium | 921mg | 1221 mg | 1729mg | 1602 mg | 1787 mg | 2089 mg |
| % of UL | 61% | 64% | 75% | 70% | 78% | 91% |
| Vitamins | ||||||
| Vitamin A (in µg RAE)* | 469 µg | 599 µg | 872 µg | 793 µg | 898 µg | 1023 µg |
| % of RDA | 156% | 150% | 125% | 113% | 128% | 114% |
| Vitamin E (in mg AT) | 5.0mg | 5.9 mg | 9.1mg | 8.2 mg | 10.2 mg | 12.0 mg |
| % of RDA | 83% | 84% | 61% | 54% | 68% | 80% |
| Vitamin C | 54mg | 64 mg | 100mg | 92 mg | 117 mg | 128 mg |
| % of RDA | 359% | 258% | 154% | 123% | 155% | 142% |
| Vitamin D (in IU) | 157IU | 203 IU | 269 IU | 267 IU | 274 IU | 295 IU |
| % of AI | 26% | 34% | 45% | 44% | 46% | 49% |
| Folate (in µg DFE) | 274 µg | 363 µg | 572 µg | 491 µg | 586 µg | 746 µg |
| % of RDA | 183% | 181% | 143% | 123% | 146% | 187% |
| Choline | 160 mg | 216 mg | 326mg | 311 mg | 349 mg | 402 mg |
| % of AI | 80% | 87% | 81% | 73% | 82% | 73% |
| Fats and Fatty Acids | ||||||
| Cholesterol | 88mg | 121 mg | 192mg | 190 mg | 215 mg | 251 mg |
| % of goal (<300mg/day) | 29% | 40% | 64% | 63% | 72% | 84% |
| Saturated fatty acids | 9.7g | 10.1 g | 15.0g | 13.1 g | 18.7 g | 22.6 g |
| % of calories | 9% | 8% | 8% | 7% | 8% | 8% |
*Includes vitamin A precursors
Note: Results for all nutrients at all calorie levels are provided in Appendix Tables E-3.1.A6 and E-3.1.A7.
Summary
The USDA Food Patterns have been updated using the most current food composition and food intake data available, and have been compared to current nutrient standards for adequacy and moderation. The USDA food patterns at 12 calorie levels meet almost all of their nutritional goals for adequacy. The nutrients for which adequacy goals are not met are potassium, vitamin D, vitamin E, and choline in almost all patterns. The patterns also meet almost all of their nutrient goals for moderation. Recommended amounts for all food groups and components fall, in general, within the 5th and 95th percentiles of usual intake distributions.
Additional tables available through Appendix E-3:
E-3.1.A1: USDA Healthy US-Style Food Patterns—Recommended Daily Intake Amounts.
E-3.1.A2: USDA Food Patterns—Item Clusters, Representative Foods, and Percent of Consumption
E-3.1.A3: Energy levels used for assignment of individuals to USDA Food Patterns
E-3.1.A5: 2015 Nutrient Profiles for USDA Food Patterns
E-3.1.A6: Nutrients in the USDA Healthy US-Style Food Patterns at each calorie level
Data sources for update of USDA Food Patterns
Energy requirements and nutritional goals:
Institute of Medicine. Dietary Reference Intakes for Energy, Carbohydrate, Fiber, Fat, Fatty Acids, Cholesterol, Protein, and Amino Acids. Washington, DC: The National Academies Press; 2002.
Institute of Medicine. The Essential Guide to Nutrient Requirements. Washington, DC: The National Academies Press; 2006.
Institute of Medicine. Dietary Reference Intakes for Calcium and Vitamin D. Washington, DC: The National Academies Press; 2011.
Nutrient data:
USDA National Nutrient Database for Standard Reference, Release 26. Available at http://ndb.nal.usda.gov/
Food intake data:
What We Eat in America (WWEIA), National Health and Nutrition Examination Survey 2009-10. Available at https://www.ars.usda.gov/northeast-area/beltsville-md-bhnrc/beltsville-human-nutrition-research-center/food-surveys-research-group/docs/wweianhanes-overview/
Food Group data:
Food patterns equivalents database (FPED) for WWEIA 2009-10: Available at https://www.ars.usda.gov/northeast-area/beltsville-md-bhnrc/beltsville-human-nutrition-research-center/food-surveys-research-group/docs/fped-databases/
Usual Intake distributions:
Usual Dietary Intakes: Food Intakes, US Population, 2007-10, National Cancer Institute. Available at http://appliedresearch.cancer.gov/diet/usualintakes/pop/2007-10/
Food availability data:
Food Availability Data System, USDA Economic Research Service. Available at https://data.nal.usda.gov/dataset/food-availability-capita-data-system
References on History of USDA Food Guides and Food Pattern Modeling
Welsh, S, Davis, C, Shaw, A. A brief history of food guides in the United States. Nutrition Today 1992:6-11.
Cronin, F, Shaw, A, Krebs-Smith, S, Marsland, P, Light, L, Developing a Food Guidance System to Implement the Dietary Guidelines. J Nut. Educ 1987, 19:281-302.
Welsh, S, Davis, C, Shaw, A. USDA’s Food Guide: Background and Development. Washington DC: U.S. Department of Agriculture, Human Nutrition Information Service. Misc. Publication 1514, 1993.
Britten, P, Marcoe, K, Yamini, S, Davis, C. Development of Food Intake Patterns for the MyPyramid Food Guidance System. J Nutr Educ Beh. 38: S78-S92, 2006.
Marcoe, K, Juan, WY, Yamini, E, Carlson, A, Britten, P. Development of Food Group Composites and Nutrient Profiles for the MyPyramid Food Guidance System, J Nutr Ed Behav 38: S93-S107, 2006.
Britten, P., Lyon, J., Weaver, C.M., Kris-Etherton, P.M., Nicklas, T.A., Weber, J.A., Davis, C.A. MyPyramid Food Intake Pattern Modeling for the Dietary Guidelines Advisory Committee. (2006) J Nutr Educ Behav, 38 (6 SUPPL.):S143-S152.
Britten, P, Cleveland, L, Koegel, K, Kuczynski, K, Nichols-Richardson, S. Updated USDA Food Patterns Meet Goals of the 2010 Dietary Guidelines. J Acad Nutr Diet. 2012:112(10):1648-1665.
Britten, P, Cleveland, L, Koegel, K, Kuczynski, K, Nichols-Richardson, S. Impact of typical rather than nutrient-dense food choices in the USDA Food Patterns. J Acad Nutr Diet. 2012:112(10):1560-1569.
Dietary Guidelines Advisory Committee. Report of the Dietary Guidelines Advisory Committee on the Dietary Guidelines for Americans, 2005. Washington DC: U.S. Department of Agriculture, Agricultural Research Service, August 2004, Appendix G-2.
Dietary Guidelines Advisory Committee. Report of the Dietary Guidelines Advisory Committee on the Dietary Guidelines for Americans, 2010. Washington DC: U.S. Department of Agriculture, Agricultural Research Service, May 2010, online Appendix E-3.
U.S. Department of Health and Human Services and U.S. Department of Agriculture. Dietary Guidelines for Americans, 2005. Washington DC: U.S. Department of Health and Human Services and U.S. Department of Agriculture, January 2005.
U.S. Department of Agriculture and Department of Health and Human Services. Dietary Guidelines for Americans, 2010. Washington DC: and U.S. Department of Agriculture and U.S. Department of Health and Human Services, December 2010.