Part D. Chapter 5: Food Sustainability and Safety
What is the relationship between population-level dietary patterns and food sustainability and related food security?
Conclusion Statement: Consistent evidence indicates that, in general, a dietary pattern that is higher in plant-based foods, such as vegetables, fruits, whole grains, legumes, nuts, and seeds, and lower in animal-based foods is more health promoting and is associated with lesser environmental impact (GHG emissions and energy, land, and water use) than is the current average U.S. diet. A diet that is more environmentally sustainable than the average U.S. diet can be achieved without excluding any food groups. The evidence consists primarily of Life Cycle Assessment (LCA) modeling studies or land-use studies from highly developed countries, including the United States.
DGAC Grade: Moderate
Key Findings
- The studies were consistent in showing that higher consumption of animal-based foods was associated with a greater impact on the environment and higher consumption of plant-based foods was associated with lower impact.
- The studies were consistent in showing that dietary patterns that promote health also promote sustainability.
- The studies were consistent in showing that healthier dietary patterns that adhered to dietary guidelines were more environmentally sustainable than diets typically consumed by the respective populations.
- The evidence supports that a sustainable diet can be achieved by following dietary guidance in the U.S. and national dietary guidance in other countries, without eliminating any food groups completely.
- The evidence supports the consumption of current dietary guidelines by increasing consumption of plant-based foods and modestly decreasing animal-based foods.
- Limited evidence showed that just lowering the snacks/sweets component of a dietary pattern benefits health and improves the environmental footprint.
- Overall, there was agreement across the studies regarding environmental footprints of different dietary patterns, despite varied methods of assessing environmental impact and differences in components of environmental impact assessed, e.g. GHG emissions or land use.
- There was limited and inconsistent evidence to indicate whether sustainable diets were more or less expensive than typically consumed diets in some locations.
Methodology
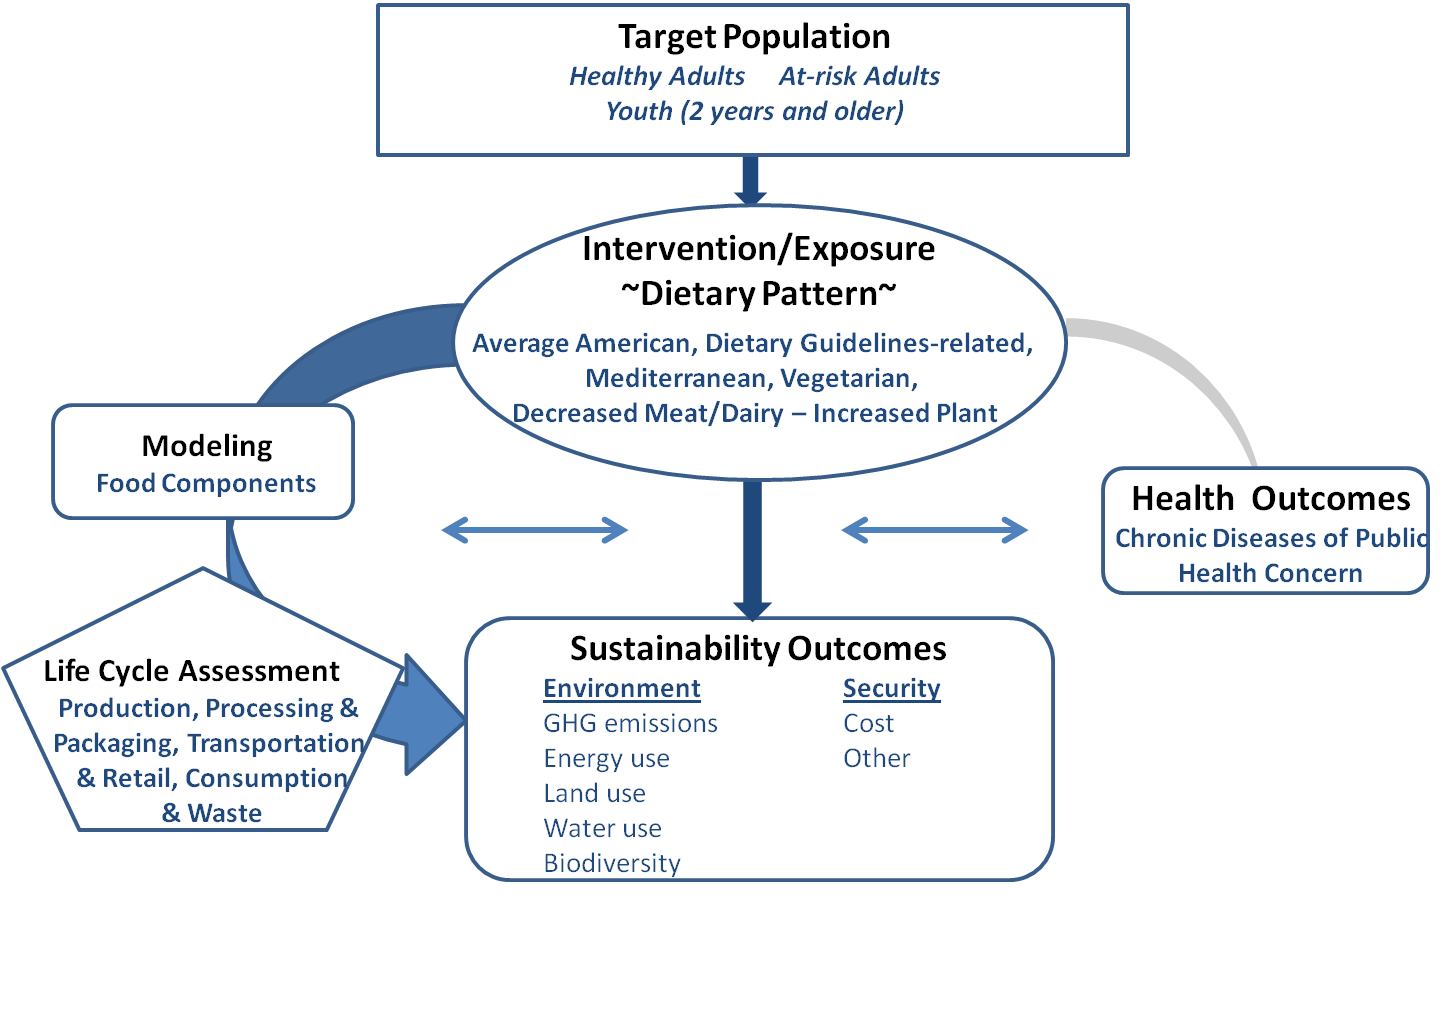
This topic is novel for a DGAC review and involves an emerging area of scientific investigation that is not readily addressed by study designs such as randomized controlled trials. The state-of-the-art of the literature related to sustainable diets and dietary patterns involves a unique combination of food pattern modeling, Life Cycle Assessment (LCA) methodology (examines all processes in the life cycle of each food component - from farm to plate to waste), and determination of the environmental outcomes of the full LCA inventory. Because of the unique nature of these studies, a modified NEL systematic review was conducted for the question on dietary patterns and sustainability. Databases included PubMed, Cochrane, Navigator, and Embase and the search covered from January 2000 to March 2014. For this topic and question, it was necessary to use different methods from those described in an original NEL protocol because not all methods in the protocol could be applied. This is sometimes necessary, according to the Cochrane Collaboration, but requires that methods from the original protocol that could not be implemented in the current review be summarized (Higgins 2011). In the standard NEL six-step protocol, step 3 to extract data and assess the risk of bias was modified. A new data extraction grid was developed with emphasis on modeling studies, LCA methodology, and environmental outcomes. The LCA is a standardized methodological framework for assessing the environmental impact (or load) attributable to the life cycle of a food product. The customized grid was then used by NEL abstractors to extract data from the included articles. In addition, NEL abstractors used a different tool to assess individual study quality or risk of bias, not the NEL Bias Assessment Tool (BAT). This alternative tool, the Critical Appraisal Checklist used by the British Medical Journal, was appropriate for studies that used a modeling design. This checklist assesses studies that use modeling to extrapolate progression of clinical outcomes, transform final outcomes from intermediate measures, examine relation between inputs and outputs to apportion resource use, and extrapolate findings from one clinical setting or population to another. To attain a high score, studies must report the variables that have been modeled rather than directly observed; what additional variables have been included or excluded; what statistical relations have been assumed; and what evidence supports these assumptions (Drummond 1996; Eddy 1985; Stevenson 2012). The checklist included key components of the British Medical Journal checklist for economic evaluations, together with the Eddy checklist on mathematical models. This Critical Appraisal Checklist was reviewed and tested for applicability by two sustainability experts who served as consultants to the DGAC.
Description of the Evidence
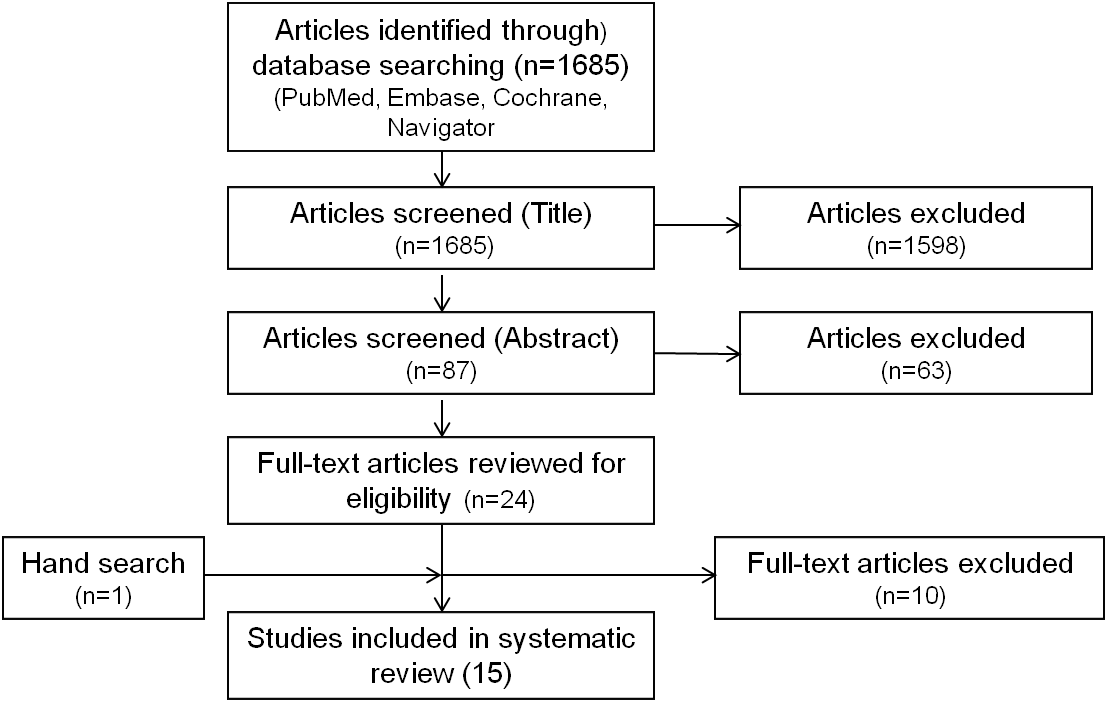
A total of 15 studies met the inclusion criteria for this systematic review. The body of evidence consisted primarily of dietary pattern modeling studies that assessed related environmental outcomes. These studies were conducted between the years 2003 and 2014 in the US (Pimentel & Pimental, 2003, Peters 2014), the UK (Aston 2012, Macdiarmid 2012, Scarborough 2012), Germany (Meier & Christen 2013), the Netherlands (van Doreen 2014), France (Vieux 2013), Spain (Sáez-Almendros 2013), Italy (Baroni 2007), Australia (Barosh 2014, Hendrie 2014), Brazil (de Carvalho 2013), New Zealand (Wilson 2013), and worldwide (Pradhan 2013). Dietary patterns that were examined included vegetarian, lacto-ovo vegetarian, and vegan dietary patterns; the average and dietary guidelines-related dietary patterns of respective countries examined; Mediterranean-style dietary patterns; and sustainable diets. The most frequent comparison diet was the average dietary pattern of the country, although numerous studies made additional comparisons across many of the above dietary patterns. Another approach was to examine diet “scenarios” that modeled different percentage replacements of meat and dairy foods with plant-based foods. The modeling studies used cross-sectional assessment of dietary intake from national nutrition surveys of representative adult populations; for example, the British National Diet and Nutrition Survey (NDNS) from studies in the UK (Aston 2012; Macdiarmid 2012), the National Nutrition Surveys (NNS) in Germany (Meier & Christen 2013), or the Australian National Nutrition Survey (Hendrie 2014) were used to determine the observed average dietary patterns. The average dietary patterns were then compared with other modeled dietary patterns, such as vegetarian or Mediterranean- style patterns, as described in detail below. All of the countries were highly developed countries with dietary guidelines and, therefore, generalizable to the U.S. population. The study quality for the body of evidence ranged from scores of 7/12 to 12/12 (indicating the evidence was of high quality) using the modified critical appraisal checklist.
Health outcomes associated with the dietary patterns were most often documented based on adherence to dietary guidelines-related patterns, variations on vegetarian dietary patterns, or Mediterranean-style dietary patterns. Diet quality was assessed in some studies using an a priori index, such as the Healthy Eating Index (HEI) or the WHO Index. In some studies, health outcomes also were modeled. For example Scarborough et al. used the DIETRON model to estimate deaths delayed or averted for each diet pattern. One study assessed the synergy between health and sustainability scores using the WHO Index and the LCA sustainability score to assess combined nutritional and ecological value (van Dooren 2014).
The environmental impacts that were most commonly modeled were GHG emissions and use of resources such as agricultural land, energy, and water. In many studies, the environmental impact for each food/food category was obtained using the LCA method. The LCA is a standardized methodological framework for assessing the environmental impact (or load) attributable to the life cycle of a food product. The life cycle for a food typically includes agricultural production, processing and packaging, transportation, retail, use, and waste disposal. An inventory of all stages of the life cycle is determined for each food product and a “weight” or number of points is then attributed to each food or food category, based on environmental impacts such as resource extraction, land use, and relevant emissions. These environmental impact results can be translated into measures of damage done to human health, ecosystem quality, and energy resources using programs such as Eco-Indicator (Goedkoop 2000). In addition to the health assessment approaches listed above, some studies used LCA analysis with a standardized approach to determine damages from GHG emissions and use of resources; these damage outcomes included human health as an environmental damage component, such as the number and duration of diseases and life years lost due to premature death from environmental causes.
Few studies assessed food security. These studies assessed food security in terms of the cost difference between an average dietary pattern for the country studied and a sustainable dietary pattern for that population (Barosh 2014, Macdiarmid 2012, Wilson 2013). The basic food basket concept was used in some studies, representing household costs for a two-adult/two-child household.
Evidence Synthesis
Themes and Key Findings
Identified Dietary Patterns and Health and Sustainability Outcomes
Vegetarian and Meat-based Diets
Several studies examined variations on vegetarian diets, or a spectrum from vegan to omnivorous dietary patterns, and associated environmental outcomes (Aston 2012; Baroni 2007; de Carvalho 2013; Peters 2007). Peters et al. examined 42 different dietary patterns and land use in New York, with patterns ranging from low-fat, lacto-ovo vegetarian diets to high fat, meat-rich omnivorous diets; across this range, the diets met U.S. dietary guidelines when possible. They found that, overall, increasing meat in the diet increased per capita land requirements; however, increasing total dietary fat content of low-meat diets (i.e. vegetarian alternatives) increased the land requirements compared to high-meat diets. In other words, although meat increased land requirements, diets including meat could feed more people than some higher fat vegetarian-style diets. Aston et al. assessed a pattern that was modeled on a feasible UK population in which the proportion of vegetarians in the survey was doubled, and the remainder adopted a diet pattern consistent with the lowest category of red and processed meat (RPM) consumers. They found the combination of low RPM + vegetarian diet had health benefits of lowering the risk of diabetes and colorectal cancer, determined from risk relationships for RPM and CHD, diabetes, and colorectal cancer from published meta-analyses. Furthermore, the expected reduction in GHG for this diet was ~3 percent of current total carbon dioxide (CO2) emissions for agriculture. De Carvalho et al. also examined a high RPM dietary pattern with diet quality assessed using the Brazilian Healthy Eating Index. They found that excessive meat intake was associated not only with poorer diet quality but also with increased projected GHG emissions (~ 4 percent total CO2 emitted by agriculture). Taken together, the results on RPM intake indicate that reduced consumption is expected to improve some health outcomes and decrease GHG emissions, as well as land use compared to “current RPM consumption.” Baroni et al. examined vegan, vegetarian, and omnivorous diets, both organically and conventionally grown, and found that the organically grown vegan diet had the most potential health benefits; whereas, the conventionally grown average Italian diet had the least. The organically grown vegan diet also had the lowest estimated impact on resources and ecosystem quality, and the average Italian diet had the greatest projected impact. Beef was the single food with the greatest projected impact on the environment; other foods estimated to have high impact included cheese, milk, and fish.
Vegetarian diets, dietary guidelines-related diets, and Mediterranean-style diets were variously compared with the average dietary patterns in selected countries (Hendrie 2014; Meier & Christen 2013; Pimentel & Pimental 2003; van Dooren 2014). Overall, the estimated greater environmental benefits, including reduced projected GHG emissions and land use, resulted from vegan, lacto-ovo vegetarian, and pesco-vegetarian diets, as well as dietary guidelines-related and Mediterranean-style dietary patterns. These diets had higher overall predicted health scores than the average diet patterns. Moreover, for the most part, the high health scores of these dietary patterns were paralleled by high combined estimated sustainability scores. According to van Doreen et al., the synergy measured across vegetarian, Mediterranean-style, and dietary guidelines-related scores could be explained by a reduction in consumption of meat, dairy, extras (i.e., snacks and sweets), and beverages, as well as a reduction in overall food consumption.
Mediterranean-Style Dietary Patterns
The Mediterranean-style dietary pattern was examined in both Mediterranean and non-Mediterranean countries (Saez-Almendros 2013; van Dooren 2014). In all cases, adherence to a Mediterranean-style dietary pattern—compared to usual intake—reduced the environmental footprint, including improved GHG emissions, agricultural land use, and energy and water consumption. Both studies limited either red and processed meat (Saez-Almendros 2013) or meat and poultry (van Dooren 2014) to less than 1 serving per week, and increased fish intake. The authors concluded that adherence to a Mediterranean-style dietary pattern would make a significant contribution to increasing food sustainability, as well as increasing the health benefits that are well-documented for this type of diet.
Diet Scenarios
Other studies examined different diet “scenarios” that generally replaced animal foods in various ways with plant foods (Scarborough 2012; Pradham 2013; Vieux 2013). Scarborough et al. found that a diet with 50 percent reduced total meat and dairy replaced by fruit, vegetables, and cereals contributed the most to estimated reduced risk of total mortality and also had the largest potential positive environmental impact. This diet scenario increased fruit and vegetable consumption by 63 percent and decreased saturated fat and salt consumption; micronutrient intake was generally similar with the exception of a drop in vitamin B12.
Pradham et al. examined 16 global dietary patterns that differed by food and energy content, grouped into four categories with per capita intake of low, moderate, high, and very high kcal diets. They assessed the relationship of these patterns to GHG emissions. Low-energy diets had < 2,100 kcal/cap/day and were composed of more than 50 percent cereals or more than 70 percent starchy roots, cereals, and pulses. Animal products were minor in this group (<10 percent). Moderate, high, and very high energy diets had 2,100-2,400, 2,400-2,800, and > 2,800 kcal/cap/day, respectively. Very high calorie diets had high amounts of meat and alcoholic beverages. Overall, very high calorie diets, common in the developed world, exhibited high total per capita CO2eq emissions due to high carbon intensity and high intake of animal products; the low-energy diets, on the other hand, had the lowest total per capita CO2eq emissions.
Lastly, Vieux et al. examined dietary patterns with different indicators of nutritional quality and found that despite containing large amounts of plant foods, not all diets of the highest nutritional quality were those with the lowest GHG emissions. For this study, the diet pattern was assessed by using nutrient-based indicators; high quality diets had energy density below the median, mean adequacy ratio above the median, and a mean excess ratio (percentage of maximum recommended for nutrients that should be limited – saturated fat, sodium, and free sugars) below the median. Four diet patterns were identified based on compliance with these properties to generate one high quality diet, two intermediate quality diets, and one low quality diet. In this study, the high quality diets had higher GHG emissions than did the low quality diets. Regarding the food groups, a higher consumption of starches, sweets and salted snacks, and fats was associated with lower diet-related GHG emissions and an increased intake of fruit and vegetables, was associated with increased diet-related GHG emissions. However, the strongest positive association with GHG emissions was still for the ruminant meat group. Overall, this study used a different approach from the other studies in this review, as nutritional quality determined the formation of dietary pattern categories.
Sustainable Diets and Costs
Three studies examined sustainable diets and related costs (Barosh 2014; Macdiarmid 2012; Wilson 2013). Barosh et al. examined food availability and cost of a health and sustainability (H&S) food basket, developed according to the principles of the Australian dietary guidelines as well as environmental impact. The food basket approach is a commonly used method for assessing and monitoring food availability and cost. The typical food basket was based on average weekly food purchases of a reference household made up of two adults and two children. For the H&S basket, food choices were based on health principles and environmental impact. The H&S basket was compared to the typical Australian basket and it was determined that the cost of the H&S basket was more than the typical basket in five socioeconomic areas; the most disadvantaged spent 30 percent more for the H&S basket. The authors concluded that the most disadvantaged groups at both neighborhood and household levels experienced the greatest inequality in accessing an affordable H&S basket. Macdiarmid et al. examined a sustainable diet (met all energy and nutrient needs and maximally decreased GHG emissions), a “sustainable with acceptability constraints” diet (added foods commonly consumed in the UK; met energy, nutrient, and fish recommendations as well as recommended minimum intakes for fruits and vegetables and did not exceed the maximum recommended for red and processed meat), and the average UK diet.They found that the sustainable diet that was generated would decrease GHG emissions from primary production (up to distribution) by 90 percent, but consisted of only seven foods. The acceptability constraints diet included 52 foods and was projected to reduce GHG emissions by 36 percent. This diet included meat and dairy but less than the average UK diet. The cost of the sustainable + acceptability diet was comparable to that of the average UK diet. These results showed that a sustainable diet that meets dietary requirements and has lower GHG can be achieved without eliminating meat or dairy products completely, or increasing the cost to the consumer. Lastly, Wilson et al. examined 16 dietary patterns modeled to determine which patterns would minimize estimated risk of chronic disease, cost, and GHG emissions. These patterns included low-cost and low-cost + low GHG diet patterns, as well as healthy patterns with high vegetable intakes including Mediterranean or Asian patterns, as well as the average New Zealand pattern. The authors found that diets that aimed to minimize cost and estimated GHG emissions also had health advantages, such as the simplified low-cost Mediterranean-style and simplified Asian-style diets, both of which would lower cardiovascular disease and cancer risk, compared to the average New Zealand diet. However, dietary variety was limited and further optimization to lower GHG emissions increased cost.
Overall, the studies were consistent in showing that higher consumption of animal-based foods was associated with higher estimated environmental impact, whereas consumption of more plant-based foods as part of a lower meat-based or vegetarian-style dietary pattern was associated with estimated lower environmental impact compared to higher meat or non-plant-based dietary patterns. Related to this, the total energy content of the diet was also associated with estimated environmental impact and higher energy diets had a larger estimated impact. For example, for fossil fuel alone, one calorie from beef or milk requires 40 or 14 calories of fuel, respectively, whereas one calorie from grains can be obtained from 2.2 calories of fuel (Pimental & Pimental 2003). Additionally, the evidence showed that dietary patterns that promote health also promote sustainability; dietary patterns that adhered to dietary guidelines were more environmentally sustainable than the population’s current average level of intake or pattern. Taken together, the studies agreed on the environmental impact of different dietary patterns, despite varied methods of assessing environmental impact and differences in components of environmental impact assessed (e.g. GHG emissions or land use). The evidence on whether sustainable diets were more or less expensive than typically consumed diets in some locations was limited and inconsistent.
Qualitative Assessment of the Collected Evidence:
Quality and Quantity
This was a reasonable body of consistent evidence with studies that directly addressed the question. The study quality for the body of evidence ranged from 7/12 to 12/12, using the critical appraisal checklist for economic evaluations (including key components of the British Medical Journal checklist for economic evaluations, together with the Eddy checklist on mathematical models (NIHR Evaluation, Trials and Studies Coordinating Centre (UK) ).
).
Consistency
There was remarkable agreement between the fifteen studies regarding environmental footprints of different dietary patterns, despite varied methods and designs to answer the question.
Impact
The evidence supports Americans consuming the current Dietary Guidelines by increasing consumption of plant-based foods, modestly decreasing animal-based foods and decreasing excessive snacks/sweets. Promoting sustainable diets will contribute to food security for present and future generations by conserving valuable resources. Moving forward, care and attention will be needed to be sure that Americans have access to and can afford a sustainable pattern of eating.
Generalizability/External Validity
Studies were conducted in the US, the UK, Germany, the Netherlands, France, Spain, Italy, Australia, Brazil, and New Zealand. These are all high HDI countries with systems of national dietary guidance similar to the US. Most of the studies based their modeling on assumed average adult diets with average caloric intake to meet energy needs, i.e. general populations of healthy adults. Taken together, the evidence from the general healthy populations in the U.S. and primarily European countries is highly generalizable to the U.S. population.
Limitations
A limitation that was common to most of the studies was that health outcomes were not assessed in the available study, but were based on earlier work on specific dietary patterns, e.g. vegetarian, Mediterranean, Western, etc. There are also known limitations to the complex process of assessing the environmental impact of foods using the Life Cycle Assessments method.
Research Recommendations
- Develop and test communication strategies to help motivate people of all ages to consume increasingly sustainable diets. This strategy will provide further rationale for the U.S. population to consume a dietary pattern closer to the Dietary Guidelines for Americans than is currently being consumed.
- Develop and test systems to ensure that sustainable diets are affordable and available to all sectors of the population.
- Develop more in-depth analysis of U.S. domestic dietary patterns and enhanced environmental sustainability with different production regimens for animal products, especially dairy and beef.
- Develop updated analysis of environmental sustainability of dietary patterns with respect to fish consumption, nutrient profiles, and different production regimens (e.g. wild caught versus farm raised).
Table 1. Summary of Studies on Dietary Patterns and Sustainability
Author, Year Study Design, Location | Diet Exposure | Results Health Outcomes | Results Sustainability or Food Security | Results Food Components | Summary of Findings | |||
|---|---|---|---|---|---|---|---|---|
Aston et al., 2012 Modeling/Data Analysis UK |
RPM consumption from National Diet and Nutrition Survey of British Adults Counterfactual UK diet was specified: vegetarians in the survey population doubled, and remainder adopted dietary pattern of lowest 5th of RPM consumers | Counterfactual diet: reduced risk from 3.2% (95% CI 1.9-4.7) for diabetes in women to 12.2% (6.4-18.0) for colorectal cancer in men | Diet-related GHG decreased by 0.47 kg CO2-e/person/day (12%) to 3.96 kg CO2-e/ person/ day in men and 3.02 kg CO2 -e/person/day in women For 2009 UK population of 61,792,000, this amounts to a total GHG reduction of 27.8 million tonnes/year (3% of current total) | Red meat accounted for 31% of dietary CO2-e emissions in men and 27% in women Processed meat accounted for an additional 10% and 8% in men and women, respectively (Habitual RPM 2.5X higher in top compared w bottom 5th ) | Reduced consumption of RPM would result in multiple benefits to health and the environment | |||
Baroni et al., 2007 Modeling/Data Analysis Italy | 7 dietary patterns:
| Ave impact (points): Health Omni-Conv - 0.46; From omnivorous diets: 15-18% of impact due to damage to respiration from inorganic chemicals | Ave impact (points): Resources Omni-Conv - 1.42; From omnivorous diets: 20-26% of impact due to fossil fuels 5-13% due to land use 41-46% due to water Ave impact (points): Ecosystem Omni-Conv - 0.27 From omnivorous diets: 3-4% of impact due to eutrophication process | Beef is the single food w/ greatest impact on environment Other high impacting foods were cheese, milk, and fish | Ave Italian-Conv diet had the greatest environmental impact The Vegan-Org diet had the lowest environmental impact Within the same method of production, a greater consumption of animal products translated to a greater impact on the environment Within the same dietary pattern, conventional production methods had a greater environmental impact than organic methods | |||
Barosh et al., 2014 Cross-sectional survey of food availability & cost Australia |
Two food baskets (typical and sustainable H&S basket) were developed for a 2-adult/2-child household and food outlets in 5 socio-economic districts were surveyed to estimate food cost, food availability and food accessibility in different household income quintile | H&S basket 1st - developed according to health principles of Australian Dietary Guidelines 2nd - food items chosen w lower environ impact | Cost of H&S basket more than typical basket in 5 socio- economic areas Most disadvantaged spent more (30%) for H&S basket | NR | Most disadvantaged groups in the region, both at the neighborhood and household levels, experienced the greatest inequality in affordability of the H&S diet | |||
de Carvalho et al., 2013 Cross-sectional health survey Brazil |
Study measured RPM intake in San Paulo, Brazil and assessed impact on diet quality and environment | Diet quality assessed using the Brazilian Healthy Eating Index Revised | GHG emissions from meat were estimated at 18,071,988 tons of CO2 equivalents, or 4% of total emitted by agriculture | 81% of men and 58% of women consumed more meat than recommended of red and processed meat
Diet quality was inversely associated with excessive meat intake in men | Excessive meat intake, associated with poorer diet quality, support initiatives and policies advising to reduce red and processed meat to recommended amounts as part of healthy and environmentally sustainable diet | |||
Hendrie et al., 2014 Modeling/ Australia | 4 dietary patterns:
| Health benefits of adhering to Australian Dietary Guidelines Core foods = red meat, chicken, fish, eggs, breads & cereals, fruit, vegetables, dairy foods and unsat oils Non-core foods = snacks, soft drinks, coffee/tea, desserts/ sweets, processed meats, SFA, and alcohol | Highest GHG: Lowest GHG: (~25% lower than ave diet) GHG from diets assessed using the input-output model of Australian economy (Australian Multi Regional Input-Output (MRIO) model) | Food groups with greatest contribution to diet-related GHG were red meat (8.0 kg CO2 /person/d) and energy-dense, nutrient poor “non-core” foods (3.9 kg CO2) Non-core foods accounted for 27% diet-related GHG | Reduction in non-core foods and consuming recommended servings of core foods are strategies to benefit population health and environment | |||
Macdiarmid et al 2012 Modeling/Data Analysis UK | 3 dietary patterns:
Iterative modeling to produce a diet that met dietary requirements while minimizing GHGEs Acceptability constraints based on average UK diet 7-d sample diet was generated to ensure diet was realistic and acceptable | Benefits from dietary recommendations: Modeled for nutrient intake based on UK diet recommendations for women 19-50y, Constraints set for energy, macronutrients, and 6 micronutrients (iron, folate, B12, zinc, calcium, and sodium) | GHG: sustainable diet gave 90% reduction in GHG, but only 7 foods Acceptability constraints gave 52 foods and reduced GHG 36%; diet included meat but less than average UK diet Diet cost: cost of Sustainable + acceptability diet was comparable to average UK cost | Meat in sustainable w/ Acceptability diet was 60% of current intake for UK women and 48% of red meat intake
Proportion of dairy was similar to current intakes, but lower in fat | A sustainable diet that meets dietary requirements for health with lower GHG can be achieved without eliminating meat or dairy products or increasing the cost to the consumer | |||
Meier & Christen, 2013 Modeling/Data Analysis Germany | 6 dietary patterns:
| Dietary guidelines and vegetarian/ vegan related health benefits | Environmental impacts per capita CO2 emissions, t/y:
NH3 emissions, kg/y:
Land use, m2/y:
Blue water** use, m3/y:
Phosphorus use, kg/y:
Primary Energy use, GJ/y:
| In comparison to the dietary guidelines and diets characterized by increasing legumes, nuts/seeds and vegetables, instead of meat, butter, egg and fish products (D-A-CH > UGB > vegetarian > vegan) could reduce impact of diet if more in line with guidelines GHG emissions and phosphorus use related to dairy are increasing, while those related to meat are declining Ammonia emissions and land use also largely driven by meat and dairy, and would be reduced w/ shift to vegan diet Increased blue water use since 1985-89 is associated w/ higher fruits, nuts, and seeds | Highest environmental impact changes would be from the vegan and lacto-ovo vegetarian diets The impact of recommendations of UGB and D-A-CH ranked 3rd and 4th All four diets achieved significant reductions compared with the average intake in 2006 Changes since 1985-89 are largely due to changes in diet | |||
Peters et al., 2007 Modeling/Data Analysis New York State | 42 dietary patterns varying in total fat and meat servings:
| All diets met USDA Food Guide Pyramid where possible | Annual per capita land requirements: ranged from 0.18 ha (0g meat, 52g fat) to 0.86 ha (381g meat, 52g fat); meat was the primary driver of increasing land use; increasing dietary intake of fat increased land requirements for low-meat diets but reduced land requirements for high-meat diets; 97.2% of the variability between diets was attributable to the quantity of meat in the diet Carrying capacity: ranged from 6.08 million persons (0g meat, 52g fat) to 2.04 million persons (381g meat, 52g fat); lower meat diets generally supported more people, but as fats increased, there was less difference between diets with different meat levels; 87.2% of the variability between diets was attributable to the quantity of meat in the diet | Meat was most land-intensive food, followed by eggs, dairy, fruits, oilseeds, vegetables, beans, then grains (Ruminant meat and milk required less land devoted to annual crop production relative to other meats) | Increasing meat in the diet increased per capita land requirements, while increasing total dietary fat increased the land requirements of low meat diets but reduced the land needed for high meat diets These results support the assertion that diet should be considered in its entirety when assessing environmental impact | |||
Pimentel & Pimentel, 2003 Modeling/Data Analysis US | 2 energy-equivalent diets:
Meat-based diet based on food balance sheets for US from FAOSTAT Composition of the lactoovovegetarian diet estimated by replacing meat and fish calories by proportionately increasing other foods consumed, except sugar and sweeteners, fats, and vegetable oils | Health benefits of lacto-ovo vegetarian diet | Cropland per capita needed for production: meat-based: 0.5 ha; vegetarian: 0.4 ha Producing 1 kg of animal protein requires 100 times more water than producing 1 kg of grain protein | Fossil energy required to produce 1 kcal of animal protein, kcal: lamb: 57; beef: 40; eggs: 39;swine:14; dairy (milk): 14; turkeys: 10; broilers: 4 Grain/forage required to produce 1 kg of animal product, kg: lamb: 21/30; beef: 13/30; eggs: 11/0; swine: 5.9/0; turkeys: 3.8/0; broilers: 2.3/0; dairy (milk): 0.7/1 Red meat generally requires more resources to produce than non-meat animal proteins (eggs, milk) | Meat-based diet requires more energy, land, and water resources, making the lactoovovegetarian diet more sustainable than the current average US diet | |||
Pradham et al., 2013 Modeling/Data Analysis Global | 16 dietary patterns, grouped according to energy content: low-calorie (patterns 1-3), moderate-calorie (patterns 4-8), high-calorie (patterns 9-11), and very high-calorie (patterns 12-16). Within each group, dietary patterns differed in the composition of food groups Dietary patterns were characterized using global time series data on food consumption and composition per country from FAOSTAT during 1961-2007 Data included 11 food groups: animal products, cereals, pulses, starchy roots, oilcrops, vegetable oils, vegetables, fruits, sugar-sweeteners, sugarcrops, and alcoholic beverages | NR | High-calorie diets required high per-capita energy inputs (1,800-3,500 kcal/d) Per-capita fossil-fuel related GHGEs ranged from 0.64 to 1.35 kg CO2 eq/d for very high-calorie diets, to between 0.03 and 0.05 kg CO2 eq/d for low-calorie diets Non-CO2 GHGEs were generally high for low- and moderate-calorie diets, and resulted in high total GHGEs for those patterns For high- and very high-calorie patterns, non-CO2 GHGE intensities for crop and livestock were smaller, indicating high-energy input and management strategies make agriculture more productive in developed countries, which were generally associated with higher-calorie patterns Total GHGEs only slightly higher for high- and very high-calorie diets (2.48-6.10 kg CO2 eq/d) compared to low- and moderate-calorie diets (1.43-4.48 kg CO2 eq/d) | Non-CO2 GHGE intensities were higher for livestock (1.44-13.06 g CO2 eq/kcal) than for crops (0.31-1.81 g CO2 eq/kcal), indicating that a dietary shift towards consuming fewer animal products would help reduce GHGEs | Low-calorie diets showed a similar emission burden to moderate- and high-calorie diets, which could be explained by a less efficient calorie production per unit of GHGEs in developing countries, which were mainly associated with low-calorie diets Very high-calorie diets were prevalent in developed countries and were associated with high total per-capita GHGEs due to high carbon intensity and high intake of animal products | |||
Sáez-Almendros 2013 Model/ Spain | 4 Diets (comparable in energy content):
Mediterranean DP was obtained from the new MDP pyramid Spanish dietary pattern was estimated from the FAOSTAT food balance sheets for 2007, and also independently from the Household Consumption Surveys of the Spanish Ministry of Agriculture, Food and Environment WDP was also obtained from FAOSTAT food balance sheets for 2007 | Documented health benefits of Med Diet Pattern (MDP) | Agricultural land use, 103Ha/y: Adherence to MDP: decrease GHG 72% | Animal products contributed significantly to increasing diet pattern footprints Energy consumption: dairy had highest contribution for all diets, followed by meat for WDP, fish for SCP, and vegetables for MDP Water consumption: dairy and vegetable oils both had the highest contribution GHG emissions: meat contributed most for WDP and SPC, while dairy most for MDP For land use: cereals and vegetable oils most after dairy and meat. | The MDP in Spain would reduce GHG (72%), agricultural land use (58%) and energy consumption (52%), and water consumption (33%) Adherence to a WDP would increase all of these between 12% - 72% Adherence to a Mediterranean dietary pattern would make a significant contribution to increasing both food sustainability and the well-known benefits for public health | |||
Scarborough et al., 2012 Modeling/Data Analysis UK | Baseline diet, plus 3 dietary scenarios from the UK Committee on Climate Change (CCC):
| Total deaths delayed or averted per year compared with baseline diet [95% credible interval]:
CHD, stroke, and cancer mortality DIETRON model used to estimate deaths delayed or averted under each diet | Diet 1: Diet 2: Diet 3: | For Diet 1, increased fruits & vegetables was biggest contributor to deaths delayed Reductions in salt or changes in FAs made smaller contribution | Diet 1 was largest contributor to deaths delayed or averted and largest environmental impact | |||
van Doreen et al., 2014 Modeling/Data Analysis The Netherlands | 6 dietary patterns:
Average Dutch diet based on Dutch National Food Consumption Survey 1998 DDG diet based on the 2006 Dutch Dietary Guidelines for adult women Vegetarian diet replaced meat with eggs, pulses and nuts, and meat substitutes Vegan diet substituted milk with calcium-enriched soy drinks and eggs with pulses Semi-vegetarian, average of DDG + vegetarian diets Mediterranean diet based on the Med pyramid, lower in meat and high in fish, fruits, vegetables, plant oils | Health scores: Omega-3 fish oils were lacking in the vegan and vegetarian diet Compared with the average Dutch diet, all other diets had significant health benefits in terms of reducing chronic disease risk | Sustainability scores: GHG index: LU index: | Foods contributing most to GHG emission of the Dutch diet are: Foods contributing most to LU are: Greatest reduction in GHG and LU can be obtained by reducing consumption of meat, dairy products, extras, and drinks (alcoholic, juices, soft drinks, coffee, and tea), in that order | Compared with the average Dutch diet, a healthy diet that is in compliance with the DDG is likely to result in a higher sustainability score The Mediterranean diet, which had the highest health score, also had a higher sustainability score than the average dutch Diet The diets with the optimal synergy between health and sustainability were those that were oriented in between a health focus and animal protein reduction (eg. semi-vegetarian or pesco-vegetarian) | |||
Vieux et al., 2013 Modeling/Data Analysis France | Self-selected diets of 1,918 French adults, classified into 4 patterns based on nutritional quality: Based on indicators of nutritional quality:
| Highest nutrition quality diets have MAR above median, MER and ED below median | Without adjustment, diet-related GHG were not significantly different between the 4 classes for men, but were significantly greater in the High class for women (p<0.0001) After adjusting for diet weight, GHG no longer significantly different across classes for either sex After adjusting for energy intake, high-quality diets were associated with higher GHG for both men and women (+9% and +22%, respectively; P<0.0001 for both) | Ruminant meat associated with the greatest GHG GHG per 100 g, gCO2 e/d (in decreasing order): GHGEs per 100 kcal, gCO2 e/d (in decreasing order): | More nutrient-dense diets were associated with higher levels of GHG, even though they contained more plant-based products Food groups such as sweets and salted snacks were negatively associated with diet-related GHG, while fruits and vegetables were positively associated with diet-related GHG. | |||
Wilson et al 2013 Modeling/Data Analysis New Zealand | 16 dietary patterns (4 groups: low-cost, minimize GHG emissions, "relatively healthy", and "more familiar meals") with equivalent in energy and met dietary requirements:
| All diets likely to be healthier than current average NZ diet for preventing non-communicable diseases Compared with the typical NZ dietary pattern, the low-cost and low-GHG optimized dietary patterns provide advantages for cardiovascular disease prevention Benefits included higher PUFA/SFA ratio, less SFA from meat, lower sodium and higher potassium intake High vegetable diets (C4, MED, ASIAN) also provided benefits against colon cancer due to higher fiber intake | GHG emissions, kg CO2 e/d (asterisk indicates that scenario minimized this variable): Scenario G2 (low GHG, higher cost) associated with the lowest GHG emissions Scenario G4 (low GHG, vegan) had slightly higher GHGs than the other GHG-reduction scenarios "Healthier diets" scenarios, ASIAN-G (Asian diet, low GHG) and MED-G (Mediterranean diet, low GHG) associated with higher GHGs than those that aimed to reduce GHGs without following a healthier diet Increasing dietary variety and acceptability increased the daily cost; however, only 2 scenarios cost more than $7/d, and all scenarios cost less than half the estimated cost of current average NZ diet | Compared with scenario C1 (low-cost), scenario G1 (low-cost, low-GHGs [NZ values]) resulted in:
| All diets that aimed to minimize cost or GHGs were both less expensive and more healthy than the current average NZ diet Low-cost and low-GHG diets were generally complementary, with scenario G2 (low GHG, higher cost) being associated with the lowest GHG emissions "Healthier diets" that minimized GHGs achieved smaller GHG reductions than scenarios that aimed to reduce GHGs without following a healthier diet | |||
References
- Aston LM, Smith JN, Powles JW. Impact of a reduced red and processed meat dietary pattern on disease risks and greenhouse gas emissions in the UK: a modelling study. BMJ Open. 2012;2(5). PMID: 22964113. http://www.ncbi.nlm.nih.gov/pubmed/22964113.
- Baroni L, Cenci L, Tettamanti M, Berati M. Evaluating the environmental impact of various dietary patterns combined with different food production systems. Eur J Clin Nutr. 2007;61(2):279-86. PMID: 17035955. http://www.ncbi.nlm.nih.gov/pubmed/17035955.
- Barosh L, Friel S, Engelhardt K, Chan L. The cost of a healthy and sustainable diet--who can afford it? Aust N Z J Public Health. 2014;38(1):7-12. PMID: 24494938. http://www.ncbi.nlm.nih.gov/pubmed/24494938.
- de Carvalho AM, Cesar CL, Fisberg RM, Marchioni DM. Excessive meat consumption in Brazil: diet quality and environmental impacts. Public Health Nutr. 2013;16(10):1893-9. PMID: 22894818. http://www.ncbi.nlm.nih.gov/pubmed/22894818.
- Hendrie GA, Ridoutt BG, Wiedmann TO, Noakes M. Greenhouse gas emissions and the Australian diet--comparing dietary recommendations with average intakes. Nutrients. 2014;6(1):289-303. PMID: 24406846. http://www.ncbi.nlm.nih.gov/pubmed/24406846.
- Macdiarmid JI, Kyle J, Horgan GW, Loe J, Fyfe C, Johnstone A, et al. Sustainable diets for the future: Can we contribute to reducing greenhouse gas emissions by eating a healthy diet? Am J Clin Nutr. 2012;96(3):632-9. PMID: 22854399. http://www.ncbi.nlm.nih.gov/pubmed/22854399.
- Meier T, Christen O. Environmental impacts of dietary recommendations and dietary styles: Germany as an example. Environ Sci Technol. 2013;47(2):877-88. PMID: 23189920. http://www.ncbi.nlm.nih.gov/pubmed/23189920.
- Peters CJ, Wilkins JL, Fick GW. Testing a complete-diet model for estimating the land resource requirements of food consumption and agricultural carrying capacity: The New York State example. Renewable agriculture and food systems. 2007;22(2):145-53. http://journals.cambridge.org/action/displayAbstract?fromPage=online&aid=1091328&fileId=S1742170507001767.
- Pimentel D, Pimentel M. Sustainability of meat-based and plant-based diets and the environment. Am J Clin Nutr. 2003;78(3 Suppl):660S-3S. PMID: 12936963. http://www.ncbi.nlm.nih.gov/pubmed/12936963.
- Pradhan P, Reusser DE, Kropp JP. Embodied greenhouse gas emissions in diets. PLoS One. 2013;8(5):e62228. PMID: 23700408. http://www.ncbi.nlm.nih.gov/pubmed/23700408.
- Saez-Almendros S, Obrador B, Bach-Faig A, Serra-Majem L. Environmental footprints of Mediterranean versus Western dietary patterns: beyond the health benefits of the Mediterranean diet. Environ Health. 2013;12:118. PMID: 24378069. http://www.ncbi.nlm.nih.gov/pubmed/24378069.
- Scarborough P, Allender S, Clarke D, Wickramasinghe K, Rayner M. Modelling the health impact of environmentally sustainable dietary scenarios in the UK. Eur J Clin Nutr. 2012;66(6):710-5. PMID: 22491494. http://www.ncbi.nlm.nih.gov/pubmed/22491494.
- van Dooren C, Marinussen M, Blonk H, Aiking H, Vellinga P. Exploring dietary guidelines based on ecological and nutritional values: A comparison of six dietary patterns. Food Policy. 2014;44(0):36-46. http://www.sciencedirect.com/science/article/pii/S0306919213001620.
- Vieux F, Soler LG, Touazi D, Darmon N. High nutritional quality is not associated with low greenhouse gas emissions in self-selected diets of French adults. Am J Clin Nutr. 2013;97(3):569-83. PMID: 23364012. http://www.ncbi.nlm.nih.gov/pubmed/23364012.
- Wilson N, Nghiem N, Ni Mhurchu C, Eyles H, Baker MG, Blakely T. Foods and dietary patterns that are healthy, low-cost, and environmentally sustainable: a case study of optimization modeling for New Zealand. PLoS One. 2013;8(3):e59648. PMID: 23544082. http://www.ncbi.nlm.nih.gov/pubmed/23544082
References not included in the review:
- Higgins JPT GSe. Cochrane Handbook for Systematic Reviews of Interventions Version 5.1.0: The Cochrane Collaboration; 2011. Available from: www.cochrane-handbook.org.
- Drummond MF, Jefferson TO. Guidelines for authors and peer reviewers of economic submissions to the BMJ. The BMJ Economic Evaluation Working Party. BMJ. 1996;313(7052):275-83. PMID: 8704542. http://www.ncbi.nlm.nih.gov/pubmed/8704542.
- Eddy D. The role of mathematical modelling in Assessing medical technology,. Technology Assessment. 1985:144-54.
- Stevenson M, Lloyd-Jones M, Morgan MY, Wong R. Non-invasive diagnostic assessment tools for the detection of liver fibrosis in patients with suspected alcohol-related liver disease: a systematic review and economic evaluation. Health Technol Assess. 2012;16(4):1-174. PMID: 22333291. http://www.ncbi.nlm.nih.gov/pubmed/22333291.
- Goedkoop M SR. The Eco-Indicator 99, A Damage Oriented Method for Life Cycle Assessment Methodology Report 2000. Available from: https://www.researchgate.net/publication/285641235_The_ecoindicator-99_A_damage_oriented_method_for_life_cycle_impact_assessment_Methodology_annex.
Supplementary Material: Food Components/Individual Foods for Sustainability Studies
High vs Low Sustainable Diets
(Individual foods provided when reported)
Study Dietary Patterns | Vegetables | Fruits | Cereals/Grains | Legumes Nuts/Seeds | Meat | Seafood
| Beverages | Dairy/ Eggs | Fats/ Oils | Sweets/ Snacks |
|---|---|---|---|---|---|---|---|---|---|---|
Aston 2012 UK Counterfactual (combination of lowest RPM + Vegetarian) diet vs current intake British National Diet and Nutrition Survey (NDNS) | Fruit and vegetables: Vegetables (1) (Roots, onions, brassicas) Vegetables (2) (All other) Tomato | Fruit and vegetables: Fruit | Starchy staples: Bread Breakfast Pasta Rice Unprocessed potato Frozen potato Other potato Flour/other grains | Fruit and vegetables: Pulses | Unprocessed Red meat‡: Beef, veal, pork, lamb, other White Meat Processed meat: Primarily beef ↓ Red & Processed Meat (RPM) 91 → 53 g/day (42%) in men 54 → 30 g/day (44%) in women | Fish: Fresh fish Shell fish Frozen fish | Beverages: Soft bev Mineral water Alcoholic bev Fruit juice Coffee Tea Cocoa Tap water | Dairy/Eggs: Milk Cheese Ice Cream Eggs | Fats: Butter Margarine Cooking oil | Other: Crispbread Biscuits Buns/cakes Chocolate/ Sweets Sugar/honey Jam/ Marmalade |
Baroni 2009 Italy Vegan vs Ave Italian diet Ave Italian (Eurostat, Euromeat, FAO) ‘Vegan’ defined a plant only diet, which excludes any food of animal origin, such as meat, fish, milk, dairy products and eggs | Descending order of environmental impact: Beef Sole fish Fresh cheese Aged cheese Milk Yogurt Vegetables Tuna fish Poultry Rice Whole bread White bread Pasta Fruit Crisp bread Jam Sugar | Descending order of environmental impact: Beef Sole fish Fresh cheese Aged cheese Milk Yogurt Vegetables Tuna fish Poultry Rice Whole bread White bread Pasta Fruit Crisp bread Jam Sugar | Descending order of environmental impact: Beef Sole fish Fresh cheese Aged cheese Milk Yogurt Vegetables Tuna fish Poultry Rice Whole bread White bread Pasta Fruit Crisp bread Jam Sugar | Vegan excluded any type of animal flesh, including meat and fish ↓ 0 g/day Beef Poultry | Vegan excluded any type of animal flesh, including meat and fish ↓ 0 g/day Sole fish Tuna fish | Vegan excluded any food of animal origin, such as milk, dairy products and eggs ↓ 0 g/day Fresh cheese Aged cheese Milk Yogurt | Descending order of environmental impact: Beef Sole fish Fresh cheese Aged cheese Milk Yogurt Vegetables Tuna fish Poultry Rice Whole bread White bread Pasta Fruit Crisp bread Jam Sugar | |||
Barosh 2014 Australia H&S basket§ (based on Australian DGs & environment) vs typical basket (hypothetical household purchases) (weekly) | Food Group: Vegetables: Typical –zucchini Sustainable – carrots | Food Group: Fruit: Typical –apples Sustainable - oranges | Food Group: Grains (cereal): Typical –white bread Sustainable – whole meal | Food Group: Meats & poultry, fish, eggs, tofu, nuts, and seeds, legumes/beans No examples of typical vs sustainable choices for tofu, nuts, and seeds, legumes/beans | Food Group: Meats & poultry, fish, eggs, tofu, nuts, and seeds, legumes/beans: Typical –beef Sustainable - kangaroo | Food Group: Meats & poultry, fish No examples of typical vs sustainable choices for fish | Food Group: Milk, yogurt, cheese Typical –cheese Sustainable - yogurt | |||
de Carvalho 2013 Brazil Red and Processed Meat (RPM) pattern ISA-Capital 2003 study Health Survey for Sao Paulo Multiple Source Method used to model RPM intake | RPM: Sum of red meat (beef and pork) and processed meat (cured, salted, smoked or with chemical preservatives) RPM intake = 106 g/d 73 g beef 8 g pork 25 g processed meat (High intake = >500g/wk) | |||||||||
Hendrie 2014 Australia Foundation diet: reduced energy Australian DG diet w/ only core foods vs average Australian diet Australian Nat Nutrition Survey | Core foods: ↑ Vegetables 331 → 432 g/d | Core foods: ↑ Fruit 210 → 300 g/d | Core foods: ↑ Breads/ cereals 244 → 324 g/d | Core foods: ↓ Red meat 73 → 65 g/d ↑ Poultry 35 → 50 g/d Non-Core foods: ↓ Processed meats 27 → 0 g/d | Core foods: ↑ Fish 24 →30 g/d | Non-core foods: ↓ Soft drinks, coffee/tea 298 → 0 ↓ Alcohol 254 → 0 g/d | Core foods: ↑ Dairy foods 263 → 408 g/d ↓ Eggs 14 → 8 g/d | Core foods: ↑ Unsat oils 16 → 26 g/d Non-core foods: ↓ SFA 4 → 0 g/d | Non-core foods: ↓ Snacks, desserts/ sweets 172 →0 g/d | |
Macdiarmid 2012 UK Sustainable w/ Acceptability Constraints vs average UK diet Diet modeled on UK dietary requirements for adult women National Diet & Nutrition Survey | ↑ Fruit & Vegetables: 330 → 555 g/d Carrots, turnips (cooked) Tomatoes Peas Brassicas Cauliflower, broccoli, spinach Sweet corn Cucumber Lettuce Mushrooms (fried) Onions (fried) Peppers | ↑ Fruit & Vegetables: 330 → 555 g/d Apples, pears Bananas Grapes, kiwi, cherries Peaches, nectarines, apricots Raspberries, strawberries, blueberries Fruit juice | ↑ Starchy foods w/ potatoes: 2,936 g/wk Pasta, noodles (cooked) Rice (cooked) White bread Whole-grain bread Whole-grain, high-fiber cereals Other cereals Porridge oats Nonfried potato products Potatoes (no added fat) | ↑ Legumes: 385 g/wk Beans Baked beans Lentils (cooked) Nuts and seeds: 35 g/wk Sesame seeds Mixed nuts Beans and | ↓ Red Meat: 392 →190 g/wk Beef Pork Lamb Chicken 182 g/wk | ↑ Fish: 161 → 223 g/wk White fish Shellfish Oily fish
| Dairy products: 2,366 g/wk Skim milk Other cheese (reduced fat) Yogurt (low fat) ↓ Eggs 119 g/wk | ↓ High-fat and sweet foods: 735 g/wk Biscuits Buns, cakes, pastries Desserts Low-fat spread Fried, roasted potatoes Crisps, savory snacks Sugar Chocolate Preserves | ||
Meier & Christen, 2013 Germany Lacto-ovo or Vegan vs average German diet National Nutrition Surveys (NNS) I & II (NNS II shown) Lacto-ovo or Vegan from USDA food patterns | ↑ Vegetables: 231 → 245 g/d ↑ Potato products 80 → 107 g/d | ↓ Fruit: 347 → 250 g/d | ↑ Grains: 278 → 295 g/d | ↑ Legumes: 124 or 128 g/d ↑ Nuts/Seeds 3 → 21 or 26 g/d | ↓ Meat: 103 → 0 g/d beef, veal pork poultry other meat | ↓ Fish: 25 → 0 g/d | ↓ Butter 12→ 8 or 0 g/d ↑ Dairy 253→ 732 or 0 g/d ↑ Vegan milk products: 0 → 0 or 732 g/d ↓ Egg products: 18→ 16 or 0 g/ | ↑ Vegetable oils,margarine 15→ 27 or 34 g/d | ↓ Sugar: 70 → 32 g/d | |
Peters 2007 US 42 diets from 0 - 381 g/d meat and eggs and 20 - 45% fat calories NE US Food Commodity Intake Database Food Guide Pyramid recommended servings | Vegetables: Meet or exceed recommendations (unless total kcal limit would be exceeded) USDA Food Guide Pyramid | Fruit: Meet or exceed recommendations (unless total kcal limit would be exceeded) USDA Food Guide Pyramid | Grains: Meet or exceed recommendations (unless total kcal limit would be exceeded) USDA Food Guide Pyramid | Pulses: Meets recommendation | ↓ Meat: 7 different quantities of cooked meat and eggs, ranging from 0-381 g/d in 63.5 g/d increments Beef, pork, chicken Low fat – lean cuts High fat – all cuts Most Sustainable: Lowest meat and eggs (0 g/d) at all 3 fat intake levels | Dairy: Meets recommendation Dairy: Low fat - Milk, skim High fat - Milk, whole | Fat: 6 different levels of fat, ranging from 20-45% total calories, in 5% increments | Sugar: Limited to 10% of total kcal | ||
Pimentel & Pimentel, 2003 US Lacto-ovo vegetarian diet vs meat-based FAOSTAT Lacto-ovo estimated | ↑ Vegetables: 239 →286 kg/y | ↑ Fruit: 109 →112 kg/y | ↑ Food grain: 114 →152 kg/y | ↑ Legumes: 4.3 →7.5 kg/y ↑ Nuts: 3.1 →4.0 kg/y | ↓ Meat: 124 →0 kg/y Lamb Beef cattle Swine Turkeys Broilers | ↓ Fish: 20 →0 kg/y | ↑ Dairy Products: Dairy (milk) 256 →307kg/y ↑ Eggs: 14.5 →19.2 kg/y | ↑ Vegetable oils: 24 →25 kg/y Animal fats 6.7 →6.7 kg/y ↑ Oil crops: 6 → 8 kg/y | Sugars & sweeteners: 74 →74kg/y | |
Pradham 2013 Global Low energy diet vs. Very high energy diet (per capita intake 1870 - >3400 kcal/day (from 16 DP in 4 categories: low, mod, high, and very high kcal diets) FAOSTAT | Low energy diet¶: < 2,100 kcal/cap/day >50% cereals (pattern#1) or > 70% starchy roots, cereals, and pulses (pattern #3) <10% animal products |
| Very high energy diets‡‡: >2,800 kcal/cap/day, high amount of meat and alcohol (pattern #14 & 15) | |||||||
Sáez-Almendros 2013 Spain Mediterranean Dietary Pattern (MDP) vs Western DP (WDP) MDP: from Updated Mediterranean Diet Pyramid (2011) WDP: from US food pattern & FAOSTAT | ↑ Vegetables: 49 → 269 kg/y MDP: ≥ 2 serv/ meal Variety of colors/textures | ↑ Fruit: 111 → 175 kg/y MDP: 1-2 serv/ meal Variety of colors/textures | ↓ Cereals/Grain: 112 → 75 kg/y MDP: 1-2 serv/meal (Preferably whole grain) | Legumes: MDP: >2 serv/wk Nuts Seeds Olives: MDP: 1-2 serv/d | ↓ Meat: 133 → 16 kg/y MDP: Red meat <1 serv/wk Processed meat <1 serv/wk | Fish: 54 → 14 kg/y MDP: >2 serv/wk | ↓ Dairy: 254 → 71 kg/y MDP: 2 serv/d (lowfat) Eggs: MDP: 2-4 serv/wk | Vegetable oils and fats: 29 → 11 kg/y MDP: Olive oil 1-2 serv/meal . | ↓ Sweets: 68 → <1% kg/y MDP: <2 serv/wk | |
Scarborough 2012 UK Diet Scenario 1 vs 3 (% 2005 levels ave UK diet) Level of substitution based on food energy at the commodity level from UK food data | Scenario 1: ↓ Milk & eggs -60% ↓ All Meat - 36% ↓ Sugar - 70% ↑ Vegetables/ fruits -160% ↑ Cereals/ potatoes -133% ↑ Vegetable oils (not palm) -133% Other groups -100% | Scenario 3: Milk and eggs-100% Cow & sheep-100% ↓ Pig & poultry-50% ↓ Sugar-90% ↑ Vegetable/ fruits -110% ↑ Cereals/ potatoes -110% ↑ Vegetable oils (not palm) -110% Other groups -100% | ||||||||
van Doreen 2014 Netherlands Vegan or Mediterranean vs average Dutch (g/day) Dutch National Food Consumption Survey Vegan: ADA 2009 Mediterranean: Updated Mediterranean Diet Pyramid (2011) | ↑ Vegetables: 127 →400 or 300 g/d Fresh Other | ↑ Fruit: 103→200 or 250 g/d | ↑ Breads: 119 →210 g/d ↑ Grain products: 51 →53 or 100 g/d Potatoes: 101 →105 or 25 g/d | ↑ Pulses: 4 →21 or 75 g/d | ↓ Meat, meat products, poultry: 102 →0 or 30 g/d ↑ Soy products & meat substitutes: 2 → 43 or 4 g/d | ↑ Fish: 9 →0 or 37 g/d Mediterranean Diet: lower in meat, high in fish, fruits, and vegetables, w/ fewer extras, and plant oils instead of animal fats | ↑ Drinks: Non-alcoholic: 1,487→ 1,500 ml/d Alcoholic: 94 →150 g/d | ↓ Dairy: Milk & milk products 332 →0 or 300 g/d Eggs: 13 → 0 or 29 g/d Soy drink: 0 →450 or 0 g/d Vegan diet: milk replaced by calcium-enriched soy drinks. Protein similar to vegetarian, but eggs replaced by extra portion of pulses. Vegetables increased 200 g w/ calcium rich | Oils & Fats: 46 →45 g/d ↓ Butter 3→0 g/d | ↓ Other (extras) 859 →300 or 200g/d |
Vieux 2013 France Dietary patterns w/ indicators of nutritional quality National Survey on Food Consumption | Fruit and vegetables (including fruit juices and nuts) Most sustainable on weight basis | Fruit and vegetables (including fruit juices and nuts) Most sustainable on weight basis | Starchy foods (refined grains and unrefined starches such as whole grains, potatoes, and legumes) Most sustainable on weight basis | Ruminant meat (beef and lamb): Least sustainable on weight basis Pork, poultry, and eggs (including pork meat and deli meat such as bacon/sausage): | Fish (including shellfish) | Drinks (including water, alcohol, and hot and light drinks) | Dairy products (milk, fresh dairy products, and cheese) | Fats (animal and vegetable) | Sweets and salted snacks (including sweet drinks) | |
Wilson 2013 New Zealand Scenario G2 – minimize GHG + achieve nutrient levels w/ low (not lowest) cost vs Average NZ diet NZ Adult Nutrition Survey (NZANS) (men) + Diet scenarios∞ (16 DPs) | ↓ Fruit and vegetables: ↓ Potatoes 255 →0 or 52 g/d ↓ Carrots 97 →52 g/d ↓ Brocolli 18 → 0 g/d ↓ Peas (frozen) 24 → 0 g.d | ↓ Fruit and vegetables: ↓ Kiwifruit 29 →16 g/d ↓ Sultanas 2 →0 g/d ↓ Oranges 50 → 0 g/d | ↑ Cereals and grains: ↑ Oats (wholegrain) 14 →81 g/d ↓ Flour (wholemeal) 3 →0 g/d ↓ White flour 6 → 0 g/d | ↑ Pulses, seeds and nuts: Sunflower seeds 210 g/d Peanuts 180 g/d | ↓ Meat: ↓ Beef: 35 →0 g/d ↓ Poultry: 61 →0 g/d ↓ Processed meat: 136 →0 g/d | ↓ Fish: 65 →0 g/d | Dairy products: ↑ Milk powder 4 → 22 g/d ↓ Milk (whole, homogenized) 271 →0 g/d ↓ Eggs: 43 →0 g/d | ↑ Veg oil: 60 g/d ↓ Margarine: 13 → 0 g/d | ↓ Added sugars 22 → 0 g/d |
‡Red meat as beef, veal, pork, lamb, mutton and goat, either fresh, minced (including hamburgers) or frozen, but unprocessed other than by cooking with heat. Although processed meats were primarily red meats, the term ‘red meat’ was used to refer to ‘unprocessed red meat’. White meat as meat from poultry, fresh, minced or frozen, but unprocessed other than by cooking with heat. Processed meat as meat preserved by smoking, curing, salting or addition of nitrates, nitrites or other preservatives. Under this definition, processed meats were primarily red, but included white meats, and included ham, bacon, pastrami, salami, sausages and processed deli or luncheon meats.
§ The H&S diet was based on three overarching principles: (i) any food that is consumed above a person's energy requirement represents an avoidable environmental burden in the form of greenhouse gas emissions, use of natural resources and pressure on biodiversity; (ii) reducing the consumption of discretionary food choices, which are energy-dense and highly processed and packaged, reduces both the risk of dietary imbalances and the use of environmental resources; and (iii) a diet comprising less animal- and more plant-derived foods delivers both health and ecological benefits.
¶Countries characterized by high calorie diets exhibit a production mode that needs high fossil energy inputs (1,800– 3,500 kcal/cap/day). In countries with low calorie diets, the energy input can be as low as 80–150 kcal/cap/day. But non-CO2 GHG emission intensities are relatively high for low and the moderate calorie diets. Therefore, total GHG emissions are only slightly higher for high and very high calorie diets (2.48–6.10 kg CO2 eq./cap/day) compared to low and moderate calorie diets (1.43–4.48 kg CO2 eq/cap/day).
∞Obtained data on a wide range of individual food items and optimized towards a diet meeting nutritional requirements ("bottom-up" approach).
Supplementary Material: Search Plan and Results—Dietary Patterns & Sustainability
Search Strategy
Dates Searched: 02/20/2014 – 02/21/2014
Databases: Pubmed, Embase, Cochrane, Navigator
Year Range: 01/2000 – 02/2014
Search Terms and Dates): Total: 1685 (+ 5 dupes = 1690)
PubMed 1449 hits; 2/20/2014
(environmental footprint* OR Carbon Footprint*[tiab] OR environmental impact* OR food security* OR food insecurity* OR "Conservation of Natural Resources"[Mesh] OR "Greenhouse Effect"[Mesh] OR "Carbon Footprint"[Mesh] OR "Environmental Monitoring"[Mesh] OR ((environment*[tiab] OR food[major:noexp] OR food[ti] OR diet[major]) AND sustainab*[tiab])) OR ("Conservation of Natural Resources"[major:noexp] OR "Greenhouse Effect"[major:noexp] OR "Carbon Footprint"[major:noexp] OR
"Environmental Monitoring"[major:noexp]) OR ("Ecosystem"[Mesh] OR ecological system*[tiab] OR greenhouse*[tiab] OR "Ecosystem"[major] OR ecological system*[tiab] OR greenhouse*[tiab] OR “land use”[tiab] OR “water use”[tiab])
Eng/hum AND ("Study Characteristics" [Publication Type] OR “clinical trial”[ptyp] OR "Epidemiologic Studies"[Mesh] OR "Support of Research"[ptyp]) NOT (editorial[ptyp] OR comment[ptyp] OR news[ptyp] OR letter[ptyp] OR review[ptyp])
Embase 170; 2/20/2014
(MedDietScore OR adequacy index* OR kidmed OR “healthy eating index”) OR
((index OR score OR scoring) NEAR/3 ('diet quality' OR dietary OR nutrient* OR eating OR food OR dieti)):ti,ab
OR
(‘diet quality’ OR 'eating habit'/exp OR 'Mediterranean diet'/exp OR nordiet:ti,ab OR ‘nordic diet’:ti,ab OR DASH:ti,ab OR ‘dietary approaches to stop hypertension’:ti,ab OR vegan*:ab,ti OR vegetarian*:ab,ti OR 'vegetarian diet'/exp OR 'vegetarian'/exp OR ‘prudent diet’:ti,ab OR ‘western diet’:ti,ab OR omniheart:ti,ab OR omni:ti OR ‘plant based diet’) OR ((dietary OR eating OR food OR diet) NEAR/2 (pattern? OR habit? OR profile? OR recommendation? OR guideline?)) OR (('ethnic, racial and religious groups'/exp or Okinawa* OR ‘mediterranean') AND (diet/exp OR eating/exp OR 'food intake'/de))
AND
'environmental sustainability'/exp OR 'food security'/exp OR 'carbon footprint'/exp OR 'human impact (environment)'/exp OR 'greenhouse effect'/exp OR 'ecosystem'/de OR 'land use'/de OR 'plant water use'/exp OR (food NEAR/5 sustainab*) OR 'food insecurity'/exp OR ‘environmental impact’ OR (environment* NEAR/2 footprint) OR diet* NEAR/5 sustainab* AND [humans]/lim AND [english]/lim AND [embase]/lim
NOT [medline]/lim
Cochrane 8; 2/21/2014
(“diet quality” OR (dietary NEXT guideline*) OR (dietary NEXT recommendation*) OR ((food OR eating OR diet OR dietary) NEAR/3 (pattern OR profile OR habit)) OR (eating NEXT style*) OR (“dietary approaches to stop hypertension” OR vegan* OR vegetarian* OR “prudent diet” OR “western diet” OR nordiet OR “Nordic diet” OR omniheart OR "Optimal Macronutrient Intake Trial to Prevent Heart Disease" OR ((asia* OR western OR Okinawa* OR “plant based” OR Mediterranean OR DASH) AND (diet* OR food))) OR ((Index OR score OR indices OR scoring) NEAR/3 (dietary OR diet OR food OR eating)) OR “adequacy index” OR kidmed OR MedDietScore)
AND
((Food OR environment* OR diet) NEAR/4 (sustainab*)) OR ((carbon OR environment*) NEAR/2 footprint) OR “food insecurity” OR “food security” OR (greenhouse NEAR/1 effect*) OR (“greenhouse gas” NEAR/1 emission*) OR “land use” OR “water use”
Navigator (FSTA/BIOSIS/CAB Abstracts) 63; 2/21/2014
(MedDietScore or "adequacy index" or kidmed or ((index or score) near/2 (("diet quality") or dietary or nutrient* or eating or food or diet)) or ((Diet or dietary or eating or food) near/2 (pattern* or profile* or habit* or guideline* or recommendation*) or "diet quality") or “dietary approaches to stop hypertension” or vegan* or vegetarian* or "prudent diet" or "western diet" or omniheart or "Optimal Macronutrient Intake Trial to Prevent Heart Disease" or nordiet or “Nordic diet” OR ((Okinawa* or asia* or Chinese or japan* or Hispanic* or ethnic or "plant based" or title:omni or title:Mediterranean or DASH) near/3 (title:diet* or abstract:diet*)))
AND
((Food OR environment* OR diet) NEAR/4 sustainab*) OR ((carbon OR environment*) NEAR/2 footprint) OR “food insecurity” OR “food security” OR (greenhouse NEAR/1 effect*) OR (“greenhouse gas” NEAR/1 emission*) OR “land use” OR “water use”
Analytical Framework
Inclusion Criteria
PubMed, Cochrane, Embase, and Navigator were searched for original research articles published in English in peer-reviewed journals. Studies published since January 2000 with subjects who were healthy or at elevated chronic disease risk from countries with high or very high human development were considered. Study designs included in the review were randomized and non-randomized controlled trials, prospective cohort studies, cross-sectional studies, before and after studies, and case-control studies. Only systematic reviews, meta-analyses, and narrative reviews were excluded. Trials were required to have ≥10 subjects per arm and a follow-up of ≥80%. Studies that examined low-calorie diets and other treatment diets were excluded. Finally, studies were required to include a description of the dietary pattern along with sustainability or food security outcomes.
Search Results
Included Articles
The following articles have been determined to be relevant for inclusion in the body of evidence:
|
|
|
|
|
|
|
|
|
|
|
|
|
|
|
Excluded Articles
The table below lists the excluded articles with at least one reason for exclusion, but may not reflect all possible reasons.
| Excluded Citations | Study design excluded | Low or medium HDI country | Does not assess independent variable/exposure as defined | Outcomes of interest not studied |
|---|---|---|---|---|
| Review | |||
| X | |||
| X | X | ||
| Review | |||
| X | |||
| X | |||
| X | |||
| X | |||
| X | |||
| X | |||
| X | |||
| X | |||
| X | |||
| X | |||
| X | |||
| X | |||
| X | |||
| X | |||
| X | |||
| X | X | ||
| X | |||
| X | |||
| X | |||
| X | |||
| X | |||
| X | |||
| X | |||
| X | X | ||
| X | |||
| X | |||
| Review | |||
| X | |||
| X | |||
| X | |||
| X | |||
| X | X | ||
| X | |||
| X | |||
| X | X | ||
| Review | |||
| X | |||
| X | |||
| X | X | ||
| X | X | ||
| Review | |||
| Review | |||
| X | |||
| X | |||
| X | |||
| X | |||
| X | |||
| X | X | ||
| X | |||
| X | |||
| X | |||
| X | |||
| X | |||
| X | |||
| X | |||
| X | |||
| X | X | ||
| X | |||
| X | |||
| X | |||
| X | |||
| X | X | ||
| X | |||
| X | |||
| X | |||
| X | X | ||
| X | |||
| X | |||
| X |