Research Question
How well do the USDA Food Patterns meet the nutritional needs of children 2 to 5 years of age and how do the recommended amounts compare to their current intakes? Given the relatively small empty calorie limit for this age group, how much flexibility is possible in food choices?
Background
Note: Please see DGAC Report Appendix E3.1, Modeling Analysis: Adequacy of USDA Food Patterns for more background information about development of the USDA food patterns.
The USDA Food Patterns are intended to represent the types and amounts of foods that will provide sufficient nutrients to meet IOM nutrient recommendations and Dietary Guidelines for Americans recommendations, within calorie needs, for all age/sex groups 2 years of age and older. They are updated every five years during the deliberations of the Dietary Guidelines Advisory Committee, and are presented to the Committee for their assessment of how well the Patterns meet their goals. As part of the update, amounts recommended from each food group may be modified to reach all or most of the specified goals.
Food Patterns are created at 12 energy levels. Each level is assigned nutrient goals for one or more age/sex groups, for whom the energy level is appropriate, based on IOM Estimated Energy Requirement equations. See the food pattern modeling report on Adequacy of the USDA Food Patterns for detailed information on the development and evaluation of the overall USDA Food Patterns.
The nutritional needs and the diets of young children are different in some important ways from the nutritional needs and diets of older children and adults. This modeling analysis focuses on the adequacy of the Patterns for young children, given these differences.
Methods
- Adjusted the nutrient profiles of food groups where choices of young children differ in a substantial way from the choices of older children and adults. The vegetables, protein foods, and grain food groups already have separate nutrient profiles for subgroups within each group. However, the fruit and dairy food groups have a single nutrient profile. Therefore, the Dairy and Fruit group nutrient profiles were targeted for modification.
- Used these adjusted nutrient profiles to determine adequacy of the patterns in meeting nutritional goals for children 2 to 5 years old. Adjusted energy allotted to solid fats and added sugars as needed.
- Compared recommended intake levels for each food group and subgroup in the patterns to the actual range of intakes for this age group.
- Estimated the flexibility possible in food choices using the allowance for solid fats and added sugars.
Results
Food Group Nutrient Profiles
In the base USDA Food Patterns, the nutrient profiles for each food group take into consideration the proportion of each subgroup consumed among the entire population ages 2 and older. Children 2 to 5 years old comprise only 9.5% of this population. To determine how different the subgroup choices by young children were from average intakes of the entire population ages 2 and older, mean intakes for all subgroups within each food group of 2 to 5 year old boys and girls were compared with the mean intakes for the overall population. Mean intakes from each subgroup as a percent of total food group intake for all food groups are presented in Figures 1 to 5 (Figures 3, 4, and 5 are at end of report). The Dairy and Fruit food groups have a single nutrient profile, and there are substantial differences in the mean intakes of young children in comparison to the overall population. Therefore, the Dairy and Fruit group nutrient profiles were adjusted to reflect proportionate consumption by 2 to 5 year olds.
Figure 1. Proportion of consumption from Dairy Subgroups by children 2 to 5 years of age in comparison to the overall population ages 2 years and older.
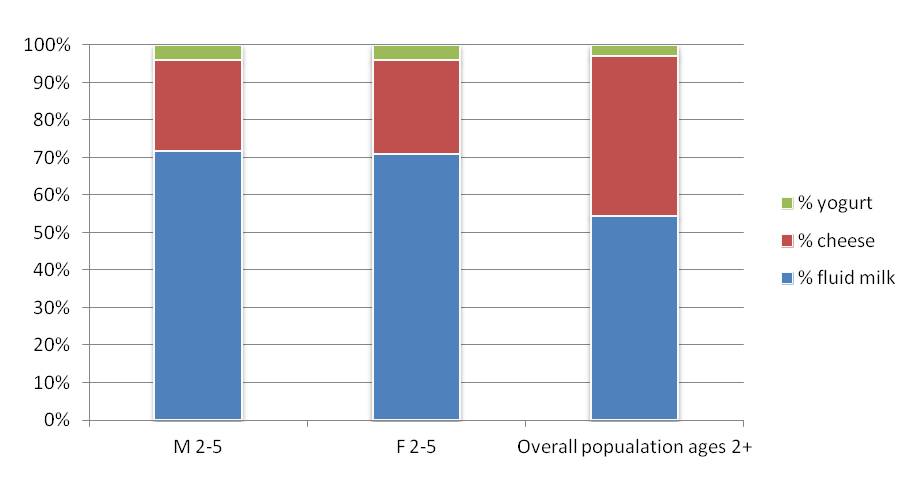
In the Dairy group, the proportion of milk to cheese consumed is higher in this age group than in the overall population, and the amount of yogurt as a proportion of Dairy intake is slightly higher (Figure 1). The adjusted Dairy group nutrient profile for young children is based on 70% fluid milk, 25% cheese, 3.5% yogurt, and 1.5% soymilk. In contrast, the profile for the overall population is based on 51% fluid milk, 45% cheese, 2.5% yogurt, and 1.5% soymilk.
Milk intake recommendations for this age group are for low-fat or fat-free milk, and assume a transition from the whole milk recommended for children until they reach the age of 2 years. Therefore, to accommodate this transition period, nutrient values for low-fat (1%) milk rather than fat-free milk were used in calculating the fluid milk portion nutrient profile.
Figure 2. Proportion of consumption from Fruit Subgroups by children 2 to 5 years of age in comparison to the overall population ages 2 years and older.
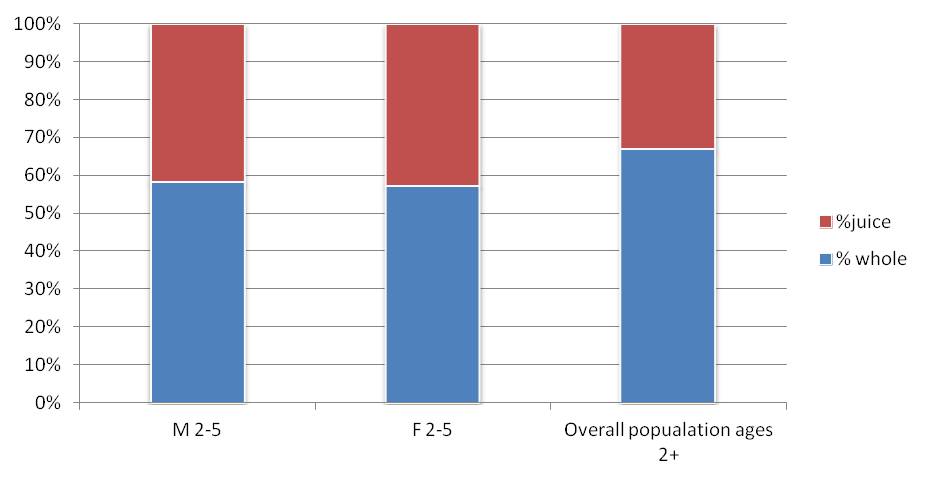
In the Fruit group, the proportion of juice to whole fruit consumed is higher in this age group than in the overall population (Figure 2). The adjusted Fruit group nutrient profile for young children is based on 42% fruit juice and 58% whole fruit. In contrast, overall population intake is about 1/3 juice and 2/3 whole fruit.
These adjustments resulted in changes in the nutrient profiles per cup equivalent of the Dairy and Fruit groups (Table 1). Compared to the Dairy group nutrient profile for the overall population, the Dairy group profile for young children contains more energy, carbohydrate, potassium, vitamin A, and vitamin D, and less total and saturated fat, and sodium. Compared to the Fruit group nutrient profile for the overall population, the Fruit group profile for young children contains more energy, carbohydrate, sodium, potassium, folate, and vitamin C, and less fiber and vitamin A.
Table 1. Nutrient profiles for the Dairy and Fruit Groups (per cup equivalent) modified for young children in comparison to the overall nutrient profiles for these food groups.
| Nutrient amount per cup equivalent | Dairy group overall | Dairy group young children | Fruit group overall | Fruit group young children |
|---|---|---|---|---|
| Energy (kcal) | 77 | 96* | 98 | 102 |
| Protein (g) | 8.7 | 8.5 | 1.1 | 1.0 |
| Total Carbohydrates (g) | 8.4 | 11.2 | 24.6 | 25.4 |
| Fiber (g) | .2 | .2 | 2.3 | 2.0 |
| Total fat (g) | .9 | 2.0 | .3 | .3 |
| Saturated Fat (g) | .6 | 1.3 | .1 | .1 |
| Calcium (mg) | 295 | 302 | 19 | 20 |
| Potassium (mg) | 235 | 297 | 311 | 323 |
| Sodium (mg) | 202 | 164 | 4 | 5 |
| Vitamin D (IU) | 59 | 80 | 0 | 0 |
| Vitamin C (g) | .1 | .1 | 34 | 38 |
| Vitamin A** (μg RAE) | 98 | 117 | 16 | 14 |
| Folate (μg DFE) | 9 | 11 | 22 | 23 |
*Higher calorie levels are due to using 1% milk and a larger proportion of fluid milk in the profile.
**Includes pro vitamin A carotenoids
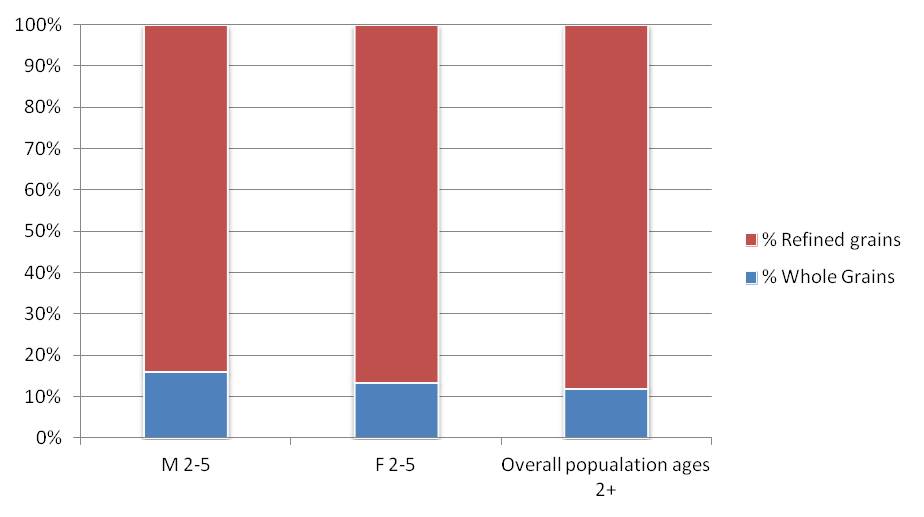
While some differences are apparent in the Vegetable, Protein Foods, and Grain food groups, these food groups have separate nutrient profiles for the subgroups within each group. There is no overall food group nutrient profile to be adjusted for these groups. Differences in the patterns of subgroup consumption within each group are shown in Figures 3, 4, and 5 (at the end of the report). Within the Vegetable group, the combined intakes of dark green, red and orange vegetables, and legumes are approximately the same for young children as for the overall population. The proportions of starchy and other vegetables vary, with young children consuming proportionately less other vegetables and more starchy vegetables than the overall population. Within the Protein Foods group, the proportion of intake from meats and processed meats combined is similar to the overall population, but young children consume relatively less meat and more processed meat. Within the Grains group, young children, especially boys, consume a somewhat larger proportion of grains as whole grains.
Energy and Nutrients in the Adjusted Patterns
The adjusted nutrient profiles were used to determine the adequacy of the Patterns at the 1000, 1200, and 1400 calorie levels for children 2 to 5 years of age. The young children’s nutrient profiles were higher in energy, resulting in 43 to 55 additional calories in the Patterns, so the amount of calories that could be allowed from solid fats and added sugars was adjusted down to keep the patterns isocaloric. The adequacy of the patterns did not change, but the following nutrient levels did change slightly:
- Potassium was higher by 4 to 5% of goal amount
- Sodium was lower by 5 to 6% of goal amount
- Vitamin D was higher by 7 to 9% of goal amount
- Vitamin A, Vitamin C, and folate were also higher in the adjusted patterns.
See Table 2 for nutrient levels in the patterns and comparison to goals.
Table 2. Selected nutrients in USDA Food Patterns at 1000, 1200, and 1400 calorie levels, with nutrient profiles modified for young children, and comparison to goals.
| Calorie Level of Pattern | 1000 | 1200 | 1400 |
|---|---|---|---|
| Target age/gender group | M/F 2-3 | F 4-8 | M 4-8 |
| Macronutrients | |||
| Minerals | |||
| Vitamins | |||
| Fats and Fatty Acids | |||
| Energy | 1005 kcal | 1198 kcal | 1403 kcal |
| Protein | 44 g | 59 g | 69 g |
| % of RDA | 335% | 309% | 362% |
| % of calories | 17% | 20% | 20% |
| Total lipid (fat) | 36 g | 40 g | 45 g |
| % of calories | 33% | 30% | 29% |
| Carbohydrate | 130 g | 157 g | 187 g |
| % of RDA | 100% | 120% | 144% |
| % of calories | 52% | 52% | 53% |
| Fiber, total dietary | 14 g | 18 g | 21 g |
| % of goal (14 g/1000 kcal) | 98% | 105% | 106% |
| Calcium | 784 mg | 995 mg | 1051 mg |
| % of RDA | 112% | 100% | 105% |
| Iron | 8 mg | 10 mg | 13 mg |
| % of RDA | 110% | 104% | 126% |
| Magnesium | 178 mg | 233 mg | 273 mg |
| % of RDA | 222% | 179% | 210% |
| Potassium | 1746 mg | 2267 mg | 2578 mg |
| % of AI | 58% | 60% | 68% |
| Sodium | 828 mg | 1100 mg | 1278 mg |
| % of UL | 55% | 58% | 67% |
| Vitamin A (in µg RAE)* | 499 µg | 638 µg | 685 µg |
| % of RDA | 166% | 159% | 171% |
| Vitamin E (in mg AT) | 4.8 mg | 5.7 mg | 6.4 mg |
| % of RDA | 80% | 81% | 91% |
| Vitamin C | 58 mg | 69 mg | 88 mg |
| % of RDA | 386% | 274% | 353% |
| Vitamin D (in IU) | 198 IU | 254 IU | 270 IU |
| % of AI | 33% | 42% | 45% |
| Folate (in µg DFE) | 279 µg | 369 µg | 444 µg |
| % of RDA | 186% | 184% | 222% |
| Choline | 178 mg | 240 mg | 280 mg |
| % of AI | 89% | 96% | 112% |
| Cholesterol | 94 mg | 127 mg | 161 mg |
| % of goal (<300mg/day) | 31% | 42% | 54% |
| Saturated fatty acids | 9.9 g | 10.3 g | 11.7 g |
| % of calories | 9% | 8% | 7% |
*Includes vitamin A precursors
Recommended Amounts in the Patterns Compared to Usual Intakes
The recommended intake levels in each Pattern were compared to the range of usual intakes for each age/sex group as part of DGAC Report Appendix E3.1, Modeling Analysis: Adequacy of USDA Food Patterns. The complete tables and graphs are in supplemental materials for that report: E3.1.A6, Recommended intakes compared to usual intake distributions. Results specific to young children include the following:
- Fruit recommendations in the 1000, 1200, and 1400 calorie Patterns of 1 or 1.5 cups per day are all between the median (0.7 cups) and 95th percentile (1.8 to 1.9 cups) intakes for males and females 1-3 and 4-8 years of age.
- Dairy recommendations in the 1000 calorie Pattern (2 cups per day) are slightly less than median intakes for 1 to 3 year olds of 2.4 (males) and 2.3 (females) cups per day. Dairy recommendations in the 1200 and 1400 calorie Patterns (2.5 cups per day) are above the median intakes for 1-3 year olds and 4 to 8 year olds of 2.1 to 2.4 (males) and 2.0 to 2.3 (females) cups per day. Recommendations are well below 95th percentile intakes for these age groups of 3.8 to 4.2 cups per day.
- Total vegetable recommendations in the 1000 calorie pattern (1 cup per day) are above the median, and below the 95th percentile of intakes for 1 to 3 year olds. Recommended amounts in the 1200 and 1400 calorie patterns (1.5 cups per day) are at the 95th percentile of intake for 4 to 8 year olds, and above the 95th percentile of intake for 1 to 3 year olds (1.3 cups). Recommended amounts of the dark green and red and orange subgroups are close the 95th percentile of intakes, while for starchy, other vegetables and legumes, recommended amounts are above median intakes but less than the 95th percentiles of intake.
- Protein Foods recommendations approximate median intakes in the 1200 and 1400 calorie patterns, and are slightly less than median intakes in the 1000 calorie pattern.
- Whole grain recommendations are above the 95th percentile of intake, as is the case for the entire population. Refined grain recommendations approximate but are slightly below the 5th percentile of intakes.
Flexibility of Food Choices in the USDA Food Patterns for Young Children
The additional calories in the Dairy and Fruit nutrient profile for young children reduced the number of calories that could be allowed for food choices with solid fats and/or added sugars to very small amounts, as described below. This reduces the flexibility of the overall Patterns. Therefore, the amounts recommended from some other food groups was explored, to determine if—for these age groups—modifications could be made to reduce recommended amounts and provide for added flexibility in food choices.
The allowance for calories from solid fats and added sugars was adjusted down in these Patterns, to account for the higher calories in the modified Dairy and Fruit nutrient profiles. In the 1000 calorie pattern, the modified allowance for calories from solid fats and added sugars is 106 calories, in comparison to 149 in the original patterns. In the 1200 and 1400 calorie patterns, the modified allowances are even lower—49 and 56 calories, respectively, in comparison to 102 and 111 in the original patterns. The lower allowances in the 1200 and 1400 calorie patterns in comparison to the 1000 calorie Pattern are the result of a larger amount of the Dairy group in these patterns, which is targeted for children 4 and older who have a higher calcium RDA. For 2 and 3 year olds, the allowance for solid fats and added sugars in these Patterns would be about roughly 100 calories. The small allowances for calories from solid fats and added sugars in all 3 Patterns would result in quite limited food choices.
Therefore, we explored options to determine if a lower intake from one of the other food groups would allow for more flexibility. For most food groups, at least one nutrient is just at the target level or is marginal. Therefore lowering the amount recommended is not feasible. For the Protein Foods group, a slightly lower amount would not result in any nutrient intakes less than the target level for this age group. A decrease of ½ ounce per day in intake would result in an allowance for calories from solid fats and added sugars from about 75 calories for 4 and 5 year olds, and up to 130 calories for 2 and 3 year olds. Another alternative to allow for more flexibility in food choices would be to reduce the fat level of the milk from 1% to fat-free milk as the child ages from 2 to 5 years old. This would allow almost 50 additional calories in the solid fats and added sugars allowance for 4 and 5 year olds, bringing their allowance to about 100 calories.
Summary
The USDA Food Patterns at appropriate calorie levels meet the nutrient needs of young children. Nutrients for which the RDAs are not met are the same as for older children and adults. The amounts recommended in the Patterns fall within the broad range of usual intakes by this age group for most food groups and subgroups. The Patterns have limited flexibility to allow for calories from solid fats or added sugars.
Figure 3. Proportion of consumption from Vegetable Subgroups by children 2 to 5 years of age in comparison to the overall population ages 2 years and older.
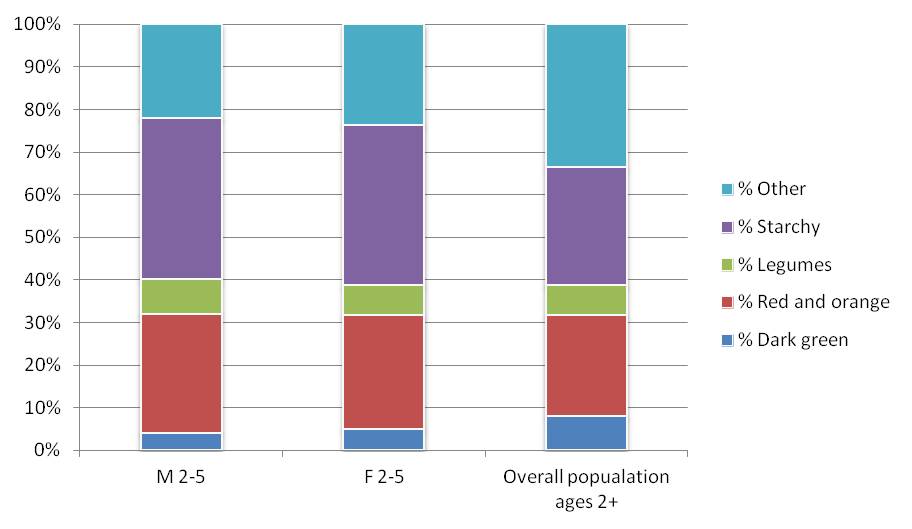
Figure 4. Proportion of consumption from Protein Foods Subgroups by children 2 to 5 years of age in comparison to the overall population ages 2 years and older.
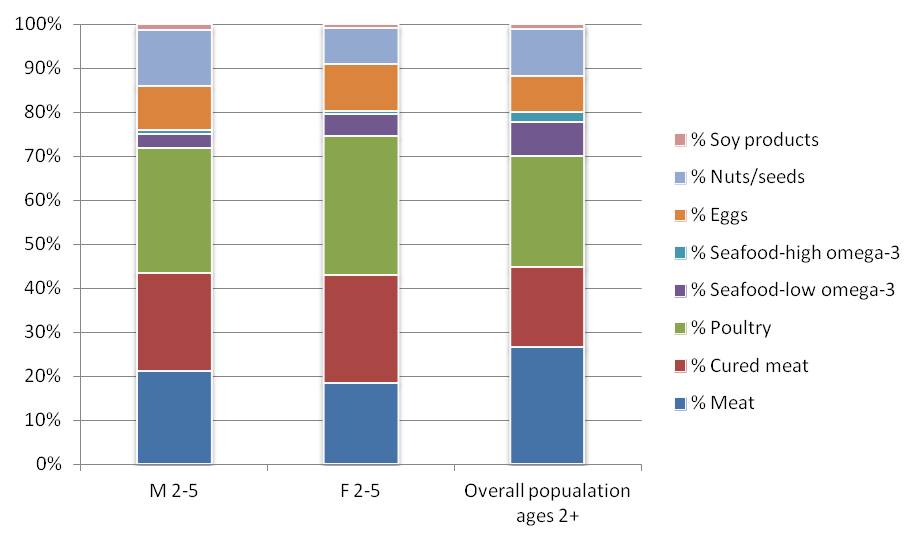
Figure 5. Proportion of consumption from Grains Subgroups by children 2 to 5 years of age in comparison to the overall population ages 2 years and older.
Data sources for update of USDA Food Patterns
Nutrient data:
USDA National Nutrient Database for Standard Reference, Release 26. Available at https://www.ars.usda.gov/northeast-area/beltsville-md-bhnrc/beltsville-human-nutrition-research-center/methods-and-application-of-food-composition-laboratory/mafcl-site-pages/sr17-sr28/
Food intake data:
What We Eat in America (WWEIA), National Health and Nutrition Examination Survey 2009-10. Available at https://www.ars.usda.gov/northeast-area/beltsville-md-bhnrc/beltsville-human-nutrition-research-center/food-surveys-research-group/docs/wweianhanes-overview/
Food Group data:
Food patterns equivalents database (FPED) for WWEIA 2009-10: Available at https://www.ars.usda.gov/northeast-area/beltsville-md-bhnrc/beltsville-human-nutrition-research-center/food-surveys-research-group/docs/fped-databases/
Usual Intake distributions:
Usual Dietary Intakes: Food Intakes, US Population, 2007-10, National Cancer Institute. Available at http://appliedresearch.cancer.gov/diet/usualintakes/pop/2007-10/
Food availability data:
Food Availability Data System, USDA Economic Research Service. Available at https://www.ers.usda.gov/data-products/food-availability-per-capita-data-system/