By: Margaux Mennesson, Communications and Marketing Manager at the Safe Routes to School National Partnership
A new report out from the Safe Routes to School National Partnership and the Y, Making Strides: 2018 State Report Cards on Support for Walking, Bicycling, and Active Kids and Communities, analyzes state policy in all 50 states plus the District of Columbia to provide a snapshot of each state’s support for walking, biking, and physical activity. The report cards look at 27 indicators of support across four key areas: Complete Streets and Active Transportation, Safe Routes to School and Active Transportation Funding, Active Neighborhoods and Schools, and State Physical Activity Planning and Support.
Why State Report Cards?
All of the indicators studied in the report cards have a great impact on a person’s ability to be physically active depending on where they live. Because our country is enormous and each region differs wildly from the others, states have a serious responsibility to support policies and practices that ensure significant benefits to residents’ health. Below are a few key areas of insight that are of particular interest for advocates and practitioners who support increasing physical activity in schools and daily life.
Physical Education Requirements in School
Children spend an average of 6.5 hours a day in school, which makes it an ideal and critical place to provide safe, supportive, inclusive physical education. Physical education in school offers structured physical development and also creates lifelong healthy habits.
The report cards looked at whether states have laws or regulations that mandate PE minutes and graduation requirements in elementary, middle, and high school according to the recommended minutes of physical activity for each age range. The report finds that 19 states required some minutes of PE in elementary school, seven of which require the number of minutes recommended by experts. For middle school, three states require the expert-recommended number of minutes while 14 states have some requirement. Only five states have a weekly PE requirement in high school.
State Physical Activity Planning and Support
States can support and promote physical activity by developing broad, comprehensive plans that set out goals, strategies, and objectives to increase physical activity among state residents. They can also ensure that public health agencies have staff focused specifically on developing and implementing these plans to further the promotion and support of physical activity.
The report finds that there is a slight improvement from 2016 to 2018 in the number of states that have a plan that addresses physical activity, from 37 in 2016 to 39 in 2018. Additionally, 20 states have staff dedicated to only physical activity planning and support and 25 states have staff working on physical activity planning and support along with other responsibilities. Compared to 2016, this is an improvement – two years ago, only 14 states had staff dedicated only to physical activity planning and support.
Supporting Active Neighborhoods and Schools
People who live in neighborhoods with close access to parks, playgrounds, and recreational facilities are not only more likely to be physically active than people who live farther away, they are also more likely to be able to walk or bike to green spaces and physical activity opportunities.
New to the 2018 report cards is an analysis that grades states based on school siting and design policies. Smart school siting policies encourage schools to be located close to where students live, making it easier for families to choose walking and biking over driving to school. The report finds that 14 states encourage consideration of walking, biking, or Safe Routes to School in school siting decisions, and seven states encourage states to be located near parks or other community facilities.
The Big Picture
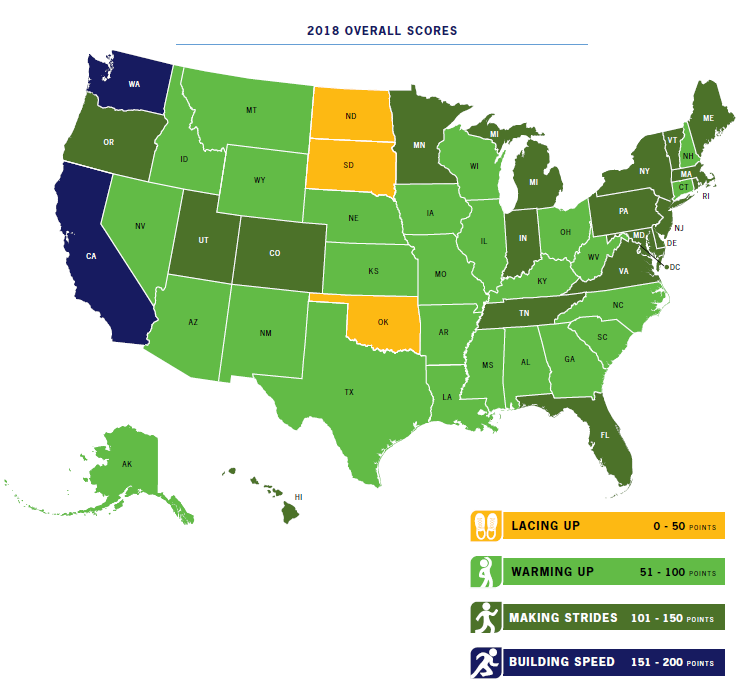
Overall, states made progress in their support for walking, biking, and physical activity from 2016 to 2018, but they still need a significant push to make deeper commitments. Most states are still scoring in the middle categories (Warming Up and Making Strides), with a similar distribution to the 2016 report cards. Additionally, the 2018 report finds the same regional trends as in 2016, with the Western and Mid-Atlantic states showing the highest overall scores, and the Midwest, South, and Mountain West showing the lowest scores.
For a deeper dive into the state report cards:
- Download the full report to see how your state scored across all 27 indicators, reflections on what each indicator means for physical activity support, and insights on where your state can improve their score.
- Need a primer on the state report cards? Check out a quick guide to understanding the report card scores.
- See a fact sheet on how to use your state report card to influence decision makers and advocate for better policies that support walking and biking.
Spread the word! Share this post with your network using this sample tweet:
How does your state score when it comes to supporting physical activity in daily life? Find the grade here: https://bit.ly/2vL2UhV