Overall Health and Well-Being Measures (OHMs) are broad, global outcome measures intended to assess the Healthy People 2030 vision. OHMs can be used to summarize and evaluate progress toward achieving Healthy People objectives.
Healthy People 2030 includes 8 OHMs, organized into 3 tiers: well-being, healthy life expectancy, and summary mortality and health.1 Unlike Healthy People 2030 Leading Health Indicators and core objectives, OHMs do not have targets.
Well-Being
Healthy Life Expectancy
Summary Mortality and Health
Data for OHMs will be added throughout 2024.
To learn how OHMs are connected to other Healthy People measures and the Healthy People 2030 vision, check out our Healthy People 2030 Objectives and Measures graphic.
Well-Being
In the top tier, OHM-01: Overall well-being is expressed as overall life satisfaction. Well-being reflects the cumulative contributions of health and non-health factors.
Learn more about OHM-01
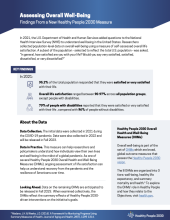
The "Assessing Overall Well-Being" fact sheet explores how data for OHM-01 were collected and highlights key findings.
The other OHMs (OHM-02 through OHM-08) summarize how efforts to achieve Healthy People objectives — including Leading Health Indicators — as well as health-related factors outside Healthy People affect overall health.
Healthy Life Expectancy
The next tier contains the 3 healthy life expectancy (HLE) measures, which combine a summary measure of mortality (life expectancy) and summary measures of health. These 3 HLE measures are:
- OHM-02: Life expectancy at birth — free of activity limitation
- OHM-03: Life expectancy at birth — free of disability
- OHM-04: Life expectancy at birth — in good or better health
These measures represent the expected number of years a person will live in good health — defined as free of activity limitation, free of disability, or in good or better health (respondent-assessed) — assuming current rates of death and disease. In this way, HLE could be viewed as a computational subpart of life expectancy (OHM-05).
However, the HLE measures reflect the combined impact of overall mortality (OHM-05) and each summary health measure (OHM-06, OHM-07, and OHM-08) shown below. This means the HLE measures provide a more comprehensive snapshot of overall health than any individual summary mortality or health measure, including life expectancy.
Summary Mortality and Health
The 3rd tier includes the 4 summary mortality and health measures, which are used individually and as the components of HLE measures. The 4 summary mortality and health measures are:
- OHM-05: Life expectancy at birth
- OHM-06: Free of activity limitation
- OHM-07: Free of disability
- OHM-08: Respondent-assessed health status — in good or better health
Monitoring OHMs
The 8 OHMs will be monitored throughout the decade to collectively illustrate the overall health and well-being of the population and demonstrate improvements. Since OHMs are broad, comprehensive measures that reflect the contributions of the Healthy People 2030 objectives to overall health and well-being, they don’t have targets and aren’t considered objectives.
Reference
1. Madans, J.H. & Weeks, J.D. (2016). A Framework for Monitoring Progress Using Summary Measures of Health. Journal of Aging and Health, 28(7), 1299-1314.