Research Question
What would be the effect on food choices and overall nutrient adequacy of limiting saturated fatty acids to 6% of total calories by substituting mono- and polyunsaturated fatty acids?
Background
Note: Please see DGAC Report Appendix E3.1, Modeling Analysis: Adequacy of USDA Food Patterns for more background information about development of the USDA food patterns.
The USDA Food Patterns are intended to represent the types and amounts of foods that will provide sufficient nutrients to meet Institute of Medicine (IOM) nutrient recommendations and Dietary Guidelines for Americans recommendations, within calorie needs. They are updated every five years during the deliberations of the Dietary Guidelines Advisory Committee, and are presented to the Committee for their assessment of how well the Patterns meet their goals. As part of the update, amounts recommended from each food group may be modified to reach all or most of the specified goals.
Food Patterns are created at 12 energy levels. Each level is assigned nutrient goals for one or more age-gender groups, for whom the energy level is appropriate, based on IOM Estimated Energy Requirement equations.
The patterns do not reflect actual intakes of Americans from each food group. Amounts recommended from each food group may be more or less than are typically consumed, so that the overall patterns reach nutrient and other goals. However, the recommended amounts from each food group are compared to usual dietary intake patterns of the U.S. population, and kept within the broad range of consumption for Americans (between the 5th and 95th percentiles of consumption).
The patterns also do not reflect the form in which foods are typically consumed. In each group, food choices are represented by nutrient-dense forms of the foods, such as fat-free milk for all fluid milk, leanest beef cuts for all beef, and ready-to-eat cereals low in added sugars for all ready-to-eat cereals.
In addition to the major food groups, the USDA Food Patterns include recommended amounts or limits for oils, solid fats, and added sugars. Oils are included in the patterns as an essential food component, because they are the major source of linoleic acid, linolenic acid, and vitamin E.
Solid fats include fats naturally present in dairy products, meat, poultry, and eggs; lard; hydrogenated or partially hydrogenated fats and shortenings; cocoa butter; coconut oil; and palm oil. For analysis purposes, the fats in stick and tub margarines and margarine spreads are considered an equal mix of Oils and Solid Fats. Solid fats are generally solid at room temperature. They are not considered essential in the USDA Food Patterns, but are included to bring the calorie levels of each Pattern to the estimated energy requirement level for each age/sex group. This allows for some added fats or food group choices in higher fat forms in all Patterns. For example, the allowance for solid fats could be used to add butter to vegetables or bread, or to select whole milk rather than fat-free milk, regular cheese rather than reduced or low-fat cheese, regular ground beef rather than 95% lean ground beef, or chicken with skin rather than chicken without skin.
See the food pattern modeling report on Adequacy of the USDA Food Patterns for detailed information on the development and evaluation of the overall USDA Food Patterns.
Methods
- Identify the amounts and sources of saturated fats in the USDA Food Patterns.
- Explore options for modifying the Food Patterns, based on sources of saturated fat in the patterns, and nutrient profiles of food pattern components.
- Remove all solid fats from the patterns and substitute iso-calorically with additional oils.
- Make additional modifications if needed to reach 6% of calories from saturated fat.
- Determine the amount of saturated fat in patterns with oils substituted for solid fats.
- Assess how the modification(s) would affect flexibility in food choices.
- Determine how the level of saturated fat in the modified patterns compares to usual intake distributions. (Is this level of saturated fat within the broad range (5th to 95th percentiles) of usual intake?)
Results
Amounts and sources of saturated fats in the USDA Food Patterns
The amounts of saturated fats in the Patterns were identified as part of the modeling analysis on Adequacy of the USDA Food Patterns. The amount, in grams and as a percent of calories, for the patterns at each calorie level, is shown in Table 1
Table 1. Amount of saturated fat in the USDA Food Patterns at each calorie level
| Calorie level (goal) | Energy (actual) | Saturated fat (g) | Saturated fat (% of kcal) |
|---|---|---|---|
| 1000 | 1003 | 9.7 | 8.7% |
| 1200 | 1204 | 10.1 | 7.5% |
| 1400 | 1399 | 11.1 | 7.1% |
| 1600 | 1595 | 13.2 | 7.4% |
| 1800 | 1798 | 15.0 | 7.5% |
| 2000 | 2003 | 18.7 | 8.4% |
| 2200 | 2198 | 19.7 | 8.1% |
| 2400 | 2401 | 22.7 | 8.5% |
| 2600 | 2604 | 24.3 | 8.4% |
| 2800 | 2801 | 25.6 | 8.2% |
| 3000 | 3001 | 28.8 | 8.6% |
| 3200 | 3201 | 33.5 | 9.4% |
Source: DGAC Report Appendix E3.1, Modeling Analysis: Adequacy of USDA Food Patterns, Tables E3.1.A6 and E3.1.A7
The sources of saturated fats in the Patterns were identified as part of the modeling analysis on Contributions of Food Groups to Nutrient Levels. As shown in Table 2, the major sources were identified as the solid fats and oils components. This is because foods used as representative nutrient-dense foods for each food group are those that are lean or low in fat. Therefore, Dairy and Protein Foods groups represent less saturated fat than would be expected with typical food choices.
Table 2. Percent contribution of each food group and food component to energy and saturated fat in the USDA Food Patterns
| Food Group | Energy | Saturated Fat |
|---|---|---|
| Percent of total, averaged across patterns | Percent of total, averaged across patterns | |
| Fruits | 9% | 1% |
| Vegetables-Total | 13% | 3% |
| Dark Green | 0% | 0% |
| Red and Orange | 2% | 0% |
| Beans and Peas | 3% | 0% |
| Starchy | 7% | 2% |
| Other | 1% | 1% |
| Whole Grains | 15% | 5% |
| Refined Grains | 13% | 5% |
| Protein Foods-Total | 14% | 20% |
| Meat | 4% | 7% |
| Poultry | 4% | 4% |
| Seafood | 2% | 1% |
| Nuts/seeds | 2% | 3% |
| Eggs | 2% | 4% |
| Soy Products | 0% | 0% |
| Dairy | 11% | 9% |
| Oils | 12% | 21% |
| Solid Fats | 7% | 36% |
| Added sugars | 6% | 0% |
Source: Table E3.5.A1 Saturated fat sources in the USDA Food Patterns
Options for modifying the Patterns to reduce saturated fat
The first step selected for lowering the total saturated fat in the patterns was to remove solid fats from the patterns, because solid fats provide more than one-third of the saturated fat in the patterns, but also because solid fats are not considered essential so removing them would not affect nutrient adequacy of the patterns.
Because the modeling request was to substitute with mono- and polyunsaturated fats (MUFAs and PUFAs), oils were substituted. Oils are the major source in the patterns of MUFAs (36%--data not shown) and PUFAs (58%--data not shown). Because the patterns already contain oils, additional oils to substitute for solid fats were added to the amount already in each pattern.
The nutrient profiles for solid fat and oils in the USDA Food Patterns are a weighted average of the nutrient profiles of fats and oils in the U.S. food supply. Updated nutrient profiles for oils and solid fats used 2010 Food Availability data from USDA’s Economic Research Service (ERS) and nutrient data for representative oils and fats from USDA’s National Nutrient Database for Standard Reference 26 (SR26). Food supply data are used because NHANES does not specify the type of oil or solid fat for most foods, and therefore those data cannot be used to determine proportional consumption. The fats and oils represented in the nutrient profiles and their relative proportions are listed in Table 3.
Table 3. Fats and oils included in the USDA Food Pattern analyses
| Type of fat or oil | Percent* of the oils or solid fat profile |
|---|---|
| OILS | |
| Unhydrogenated soy oil | 53% |
| Canola oil | 22% |
| Olive oil | 4% |
| Corn oil | 10% |
| Sunflower oil | 3% |
| Cottonseed oil | 4% |
| Peanut oil | 1% |
| Safflower oil | 0% |
| Margarine (1/2 total) | 3% |
| SOLID FATS | |
| Palm oil | 8% |
| Palm Kernel oil | 3% |
| Coconut oil | 4% |
| Dairy fat (incl. butter) | 24% |
| Pork fat (incl. lard) | 7% |
| Vegetable shortening | 19% |
| Beef fat (incl. tallow) | 18% |
| Hydrogenated soy oil | 15% |
| Margarine (1/2 total) | 3% |
* Estimates calculated from Economic Research Service Food Availability and Loss-Adjusted Food Availability tables for fats and oils (added), 2010. (https://www.ers.usda.gov/data-products/food-availability-per-capita-data-system/) Additional data on fat content of beef, pork, and dairy foods from CNPP's Nutrient Content of the Food Supply, 2010.
All fats and oils are a combination of various fatty acids, but proportions differ between various types. Solid fats tend to have a higher percentage of saturated fats than do oils. This is true in the solid fats and oils composites for the Food Patterns. As shown in Table 4, saturated fatty acids make up 41% of the total fatty acids in the solid fats profile, while they make up only about 14% of the total fatty acids in oils. Because oils contain so much less saturated fat than do solid fats, substitution of oils for solid fats should substantially lower the total amount of saturated fat in the patterns.
Table 4. Fatty acid profiles of solid fats and oils included in the USDA Food Pattern analyses
| Type of fat or oil | % Saturated Fatty Acids | % Monounsaturated Fatty Acids | % Polyunsaturated Fatty Acids |
|---|---|---|---|
| OILS | 13.6% | 34.2% | 47.7% |
| SOLID FATS | 41.0% | 34.2% | 14.4% |
Substitution of solid fats with oils
Solid fats represent from 59 to 336 total calories in the USDA Food Patterns. To substitute oils for these calories, all solid fats were removed from the patterns, and a corresponding amount of oil was added to the already existing amount of oil in each pattern, as shown in Table 5. This resulted in from 24 to 89 grams of oil in the patterns.
Table 5. Amounts of solid fats and oils in USDA Food Patterns and in Modified Patterns when oils are substituted for solid fats
| Calorie level of pattern | Solid fats in USDA Food Pattern (kcal) | Oils in USDA Food Pattern (kcal) | Solid fats in Modified Pattern (kcal) | Oils in Modified Pattern (kcal) | Oils in Modified Pattern (g) |
|---|---|---|---|---|---|
| 1000 | 84 | 131 | 0 | 215 | 25 |
| 1200 | 59 | 149 | 0 | 208 | 24 |
| 1400 | 59 | 149 | 0 | 208 | 24 |
| 1600 | 67 | 193 | 0 | 260 | 30 |
| 1800 | 92 | 210 | 0 | 302 | 35 |
| 2000 | 151 | 236 | 0 | 387 | 44 |
| 2200 | 151 | 254 | 0 | 405 | 46 |
| 2400 | 193 | 271 | 0 | 464 | 53 |
| 2600 | 210 | 298 | 0 | 508 | 58 |
| 2800 | 218 | 315 | 0 | 533 | 61 |
| 3000 | 260 | 385 | 0 | 645 | 74 |
| 3200 | 336 | 446 | 0 | 782 | 89 |
Saturated fat levels in Patterns when oils are substituted for solid fats
In the modified patterns with no solid fats and additional oil, the saturated fat levels meet or are close to 6% of calories (Table 6).
Table 6. Saturated fats in original and modified USDA Food Patterns
| Calorie level of pattern | Saturated fat in USDA Food Patterns (% of kcal) | Saturated fat in Modified Patterns (% of kcal) |
|---|---|---|
| 1000 | 8.7% | 6.2% |
| 1200 | 7.5% | 6.1% |
| 1400 | 7.1% | 5.9% |
| 1600 | 7.4% | 6.2% |
| 1800 | 7.5% | 6.0% |
| 2000 | 8.4% | 6.2% |
| 2200 | 8.1% | 6.0% |
| 2400 | 8.5% | 6.1% |
| 2600 | 8.4% | 6.0% |
| 2800 | 8.2% | 5.9% |
| 3000 | 8.6% | 6.1% |
| 3200 | 9.4% | 6.3% |
How would the proposed change affect overall nutrient adequacy of the patterns?
Eliminating solid fats from the patterns and substituting with oils has no negative effect on overall nutrient adequacy. The nutrients for which the solid fats and oils nutrient profiles differed the most were: sodium, choline, cholesterol, vitamin D, vitamin A (oils with smaller amounts than solid fats), and vitamin E (oils with larger amounts than solid fats). Only in the case of vitamin E did the substitution change the adequacy of the patterns. The vitamin E amounts in Patterns at 4 calorie levels that had been less than 90% of the RDA rose to at least 90% of the RDA.
How would the proposed modification affect flexibility in food choices?
This proposed change would have major impacts on the food choices allowed while following the Patterns. Representative foods used in this analysis are in their leanest or lowest-fat forms Some examples of food choices with zero solid fat are listed in Table 7, first column. In the current Food Patterns, individuals can choose a food with a higher fat content and still meet the Pattern guidelines by using some of their allowance for solid fats. Examples of foods with some solid fat are shown in Table 7, column 3, and the amount of solid fat they contain in column 4. If the allowance for solid fat is removed, individuals would no longer have the option to select a higher fat form of a food and stay within the Pattern guidelines. Because most food choices in the Dairy and Protein Foods groups contain some amount of solid fat, they would not be allowed in any amount in the modified Patterns and choices would be quite limited. For example, 1% milk contains 1 gram of solid fat per cup, and therefore would not meet the guidelines of modified Food Patterns with 6% of calories from saturated fat.
Table 7. Examples of nutrient-dense foods with no or low solid fat content and similar foods with higher solid fat content
| Foods in most nutrient-dense form | Solid fat in nutrient-dense form | Foods with some solid fat | Additional solid fat in alternate food choice |
|---|---|---|---|
| Fat-free milk | 0 | Low-fat (1%) milk | 1 g per cup |
| Reduced-fat (2%) milk | 3 g per cup | ||
| Fat-free yogurt | 0 | Low-fat yogurt | 2 g per cup |
| Fat-free mozzarella cheese | 0 | Part-skim mozzarella cheese | 7 g per 1.5 ounces |
| 95% lean ground beef | 0 | 85%-89% lean ground beef | 5 g per 3 ounces |
| Broiled beef steak, lean only eaten | 0 | Broiled beef steak, lean and fat eaten | 5 g per 3 ounces |
| Roast chicken without skin | 0 | Roast chicken with skin | 4 g per 3 ounces |
| Egg white | 0 | Hard cooked egg | 2 g per egg |
In addition to limiting food choices in the Dairy and Protein Foods groups, the high amount of oils in the Patterns might be challenging to incorporate into daily food choices. While for some uses of solid fats, oils can be readily substituted, there are other food choices or food preparation methods where the substitution might be challenging. Using oils to prepare (sauté, stir-fry) and season meats and vegetables is one way to include more oils in the diet. Using oil-based salad dressings is another. However, many consumers prefer butter or margarine to oils as a spread on bread and rolls, and would not consider making a change to oils on their bread. Also, most fat-free cheeses do not have the melting characteristics of regular cheese and would not be considered an acceptable substitute. Lowfat yogurt and milk are also considered more acceptable by many than the fat-free versions.
Comparison of saturated fat in modified patterns with distribution of usual intakes of saturated fat
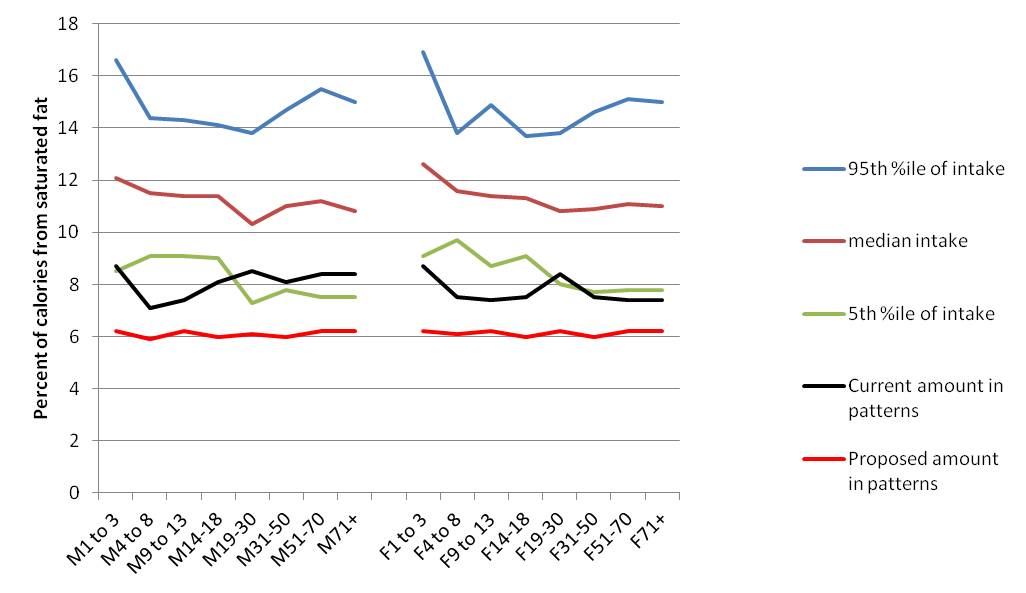
A goal for the USDA Food Patterns is to keep recommended amounts to within the broad range of usual intakes. This broad range is defined as within the 5th to the 95th percentiles of intake, as determined based on data from the National Health and Nutrition Examination Survey (NHANES). Note that the amounts of whole grains in the patterns do exceed the 95th percentile of intake, violating this goal. For nutrients over-consumed by Americans, this means that recommended amounts should not be substantially less than the amounts now consumed by the 5% of the population with lowest intakes. The 5th percentile of intake for saturated fat for the overall population is now 7.9%, approximately the level of saturated fat intake in the Food Patterns. The lower goal of 6% of calories from saturated fat is less than the 5th percentile of intake for all age-sex groups, as shown in Figure 1.
Figure 1. Comparison of saturated fat in current and proposed USDA Food Patterns to Usual Intake levels, NHANES 2007-10
Summary
The major source of saturated fat in the USDA Food Patterns is a small allowance for solid fat, which may be used to consume foods naturally containing solid fats (such as Dairy products, Meats, Poultry, and Eggs) or to consume foods that have solid fats added in processing or preparation. The amount of saturated fats in the USDA Food Patterns can be decreased from the current 7.9% to approximately 6% of calories by substituting oils, a source of MUFAs and PUFAs, for the allowance for solid fats in the patterns. This change, while feasible in theory, would result in substantial limitations on selections of foods, especially in the Dairy and Protein Foods groups. It also might be challenging for many consumers to learn how to incorporate the additional amount of oils needed for the iso-caloric substitution into their diets. The current USDA Food Patterns contain a level of saturated fat that is approximately at the 5th percentile of intake in the U.S. The proposed revision would lower that level to below the 5th percentile of intake. It is not known how many individuals consume about 6% of calories from saturated fat.
Data sources for update of USDA Food Patterns
Nutrient data:
USDA National Nutrient Database for Standard Reference, Release 26. Available at http://ndb.nal.usda.gov/
Food intake data:
What We Eat in America (WWEIA), National Health and Nutrition Examination Survey 2009-10. Available at http://seprl.ars.usda.gov/Services/docs.htm?docid=13793
Food Group data:
Food patterns equivalents database (FPED) for WWEIA 2009-10: Available at http://seprl.ars.usda.gov/Services/docs.htm?docid=23869
Usual Intake distributions:
Usual Dietary Intakes: Food Intakes, US Population, 2007-10, National Cancer Institute. Available at http://appliedresearch.cancer.gov/diet/usualintakes/pop/2007-10/
Food availability data:
Food Availability Data System, USDA Economic Research Service. Available at http://www.ers.usda.gov/data-products/food-availability-(per-capita)-data-system.aspx
Table E3.5.A1 Saturated fat sources in the USDA Food Patterns
| CALORIE LEVEL OF PATTERN | 1000 g | 1200 g | 1400 g | 1600 g | 1800 g | 2000 g | 2200 g | 2400 g | 2600 g | 2800 g | 3000 g | 3200 g |
|---|---|---|---|---|---|---|---|---|---|---|---|---|
| FRUITS | 0.1 | 0.1 | 0.1 | 0.1 | 0.1 | 0.1 | 0.1 | 0.1 | 0.1 | 0.1 | 0.1 | 0.1 |
| VEGETABLES | 0.2 | 0.3 | 0.3 | 0.4 | 0.5 | 0.5 | 0.6 | 0.6 | 0.7 | 0.7 | 0.8 | 0.8 |
| Dark-green | 0.0 | 0.0 | 0.0 | 0.0 | 0.0 | 0.0 | 0.0 | 0.0 | 0.0 | 0.0 | 0.0 | 0.0 |
| Orange | 0.0 | 0.0 | 0.0 | 0.0 | 0.0 | 0.0 | 0.0 | 0.0 | 0.0 | 0.0 | 0.0 | 0.0 |
| Legumes | 0.0 | 0.0 | 0.0 | 0.0 | 0.1 | 0.1 | 0.1 | 0.1 | 0.1 | 0.1 | 0.1 | 0.1 |
| Starchy | 0.1 | 0.2 | 0.2 | 0.2 | 0.3 | 0.3 | 0.4 | 0.4 | 0.4 | 0.4 | 0.5 | 0.5 |
| Other veg. | 0.0 | 0.1 | 0.1 | 0.1 | 0.1 | 0.1 | 0.1 | 0.1 | 0.1 | 0.1 | 0.2 | 0.2 |
| GRAINS | 0.8 | 1.1 | 1.4 | 1.4 | 1.6 | 1.6 | 1.9 | 2.2 | 2.5 | 2.7 | 2.7 | 2.7 |
| Whole grains | 0.4 | 0.5 | 0.7 | 0.8 | 0.8 | 0.8 | 0.9 | 1.1 | 1.2 | 1.3 | 1.3 | 1.3 |
| Other grains | 0.4 | 0.6 | 0.7 | 0.6 | 0.9 | 0.9 | 1.0 | 1.1 | 1.3 | 1.4 | 1.4 | 1.4 |
| PROTEIN FOODS | 1.4 | 2.1 | 2.7 | 3.4 | 3.4 | 3.8 | 4.1 | 4.4 | 4.4 | 4.8 | 4.8 | 4.8 |
| Meats | 0.5 | 0.8 | 1.0 | 1.2 | 1.2 | 1.4 | 1.5 | 1.7 | 1.7 | 1.8 | 1.8 | 1.8 |
| Poultry | 0.3 | 0.4 | 0.6 | 0.7 | 0.7 | 0.8 | 0.8 | 0.9 | 0.9 | 1.0 | 1.0 | 1.0 |
| Fish-Hi n3 | 0.0 | 0.1 | 0.1 | 0.1 | 0.1 | 0.1 | 0.2 | 0.2 | 0.2 | 0.2 | 0.2 | 0.2 |
| Fish-Lo n3 | 0.0 | 0.1 | 0.1 | 0.1 | 0.1 | 0.1 | 0.1 | 0.1 | 0.1 | 0.2 | 0.2 | 0.2 |
| Eggs | 0.3 | 0.4 | 0.5 | 0.6 | 0.6 | 0.7 | 0.7 | 0.8 | 0.8 | 0.9 | 0.9 | 0.9 |
| Soy products | 0.0 | 0.0 | 0.0 | 0.0 | 0.0 | 0.0 | 0.0 | 0.0 | 0.0 | 0.0 | 0.0 | 0.0 |
| Nuts & Seeds | 0.2 | 0.3 | 0.5 | 0.6 | 0.6 | 0.6 | 0.7 | 0.8 | 0.8 | 0.8 | 0.8 | 0.8 |
| DAIRY | 1.1 | 1.4 | 1.4 | 1.7 | 1.7 | 1.7 | 1.7 | 1.7 | 1.7 | 1.7 | 1.7 | 1.7 |
| Oils | 2.0 | 2.3 | 2.3 | 3.0 | 3.3 | 3.7 | 3.9 | 4.2 | 4.6 | 4.9 | 6.0 | 6.9 |
| Solid fats | 4.1 | 2.9 | 2.9 | 3.3 | 4.5 | 7.4 | 7.4 | 9.4 | 10.2 | 10.6 | 12.7 | 16.4 |
| Added Sugars | 0.0 | 0.0 | 0.0 | 0.0 | 0.0 | 0.0 | 0.0 | 0.0 | 0.0 | 0.0 | 0.0 | 0.0 |
| Total Saturated fat (g): | 9.7 | 10.1 | 11.1 | 13.2 | 15.0 | 18.7 | 19.7 | 22.7 | 24.3 | 25.6 | 28.8 | 33.5 |
| Total calories in pattern | 1003 | 1204 | 1399 | 1595 | 1798 | 2003 | 2198 | 2401 | 2604 | 2801 | 3001 | 3201 |
Table E3.5.A1 Saturated fat sources in the USDA Food Patterns, continued
| CALORIE LEVEL OF PATTERN | 1000 | 1200 | 1400 | 1600 | 1800 | 2000 | 2200 | 2400 | 2600 | 2800 | 3000 | 3200 |
|---|---|---|---|---|---|---|---|---|---|---|---|---|
| Percent of calories from saturated fat: | ||||||||||||
| In total pattern | 8.7% | 7.5% | 7.1% | 7.4% | 7.5% | 8.4% | 8.1% | 8.5% | 8.4% | 8.2% | 8.6% | 9.4% |
| From food groups | 3.2% | 3.7% | 3.8% | 3.9% | 3.6% | 3.5% | 3.4% | 3.4% | 3.3% | 3.2% | 3.0% | 2.9% |
| From oils | 1.8% | 1.7% | 1.5% | 1.7% | 1.6% | 1.6% | 1.6% | 1.6% | 1.6% | 1.6% | 1.8% | 1.9% |
| From solid fats | 3.7% | 2.1% | 1.8% | 1.8% | 2.3% | 3.3% | 3.0% | 3.5% | 3.5% | 3.4% | 3.8% | 4.6% |